
A probability distribution describes the possible values of a random variable and how likely those values or ranges of values are. Distributions are usually classified as discrete or continuous, depending on the kind of values the variable can take.
★What to remember
- A probability distribution describes the possible values of a random variable and how probability is assigned to them.
- A discrete random variable takes values that can be counted.
- A continuous random variable can take any value in an interval or collection of intervals.
- For a discrete distribution, probabilities of individual values add up to 1.
- For a continuous distribution, probabilities are areas under a density curve, whose total area is 1.
- A continuous variable with a density has probability 0 of taking any one exact value.
- The binomial distribution is a common model for the number of successes in a fixed number of independent trials.
- The normal distribution is a common continuous model with a symmetric, bell-shaped density.
🎧Listen3:24 · transcript
AnnaWhen someone says “probability distribution,” what are they really describing?
MarcoThey’re describing the possible values of a random variable and how probability is spread across those values. A random variable assigns a number to the outcome of a chance process. It could record a die roll, or how long a bus takes to arrive.
AnnaSo the distribution tells us more than just what can happen. It tells us how likely each value, or range of values, is. How might we represent one?
MarcoIn several ways: a table, a graph, a formula, or a cumulative distribution function. That function gives the probability that the random variable is less than or equal to a specified value.
AnnaAnd the first big distinction is whether the variable is discrete or continuous. What makes a variable discrete?
MarcoIts possible values come from a list that can be counted. The list might even be infinite. A die result is one example. So are the number of heads in a fixed number of coin tosses, or the number of calls received in an hour.
AnnaFor a discrete distribution, each possible value gets a probability. Those probabilities can’t be negative, and they add up to one across all the possible values. If we want the probability of an event, we add the probabilities of the values in that event.
MarcoRight. Some familiar models fit particular situations. Bernoulli describes one trial with two outcomes, often called success and failure. Binomial describes the number of successes across a fixed number of independent trials, with the same chance of success each time.
AnnaHow do the other common discrete models differ?
MarcoGeometric describes how many independent trials are needed to get the first success. Poisson is often used for a count of events in a fixed interval, with assumptions that include a constant average rate and independent occurrences. Those assumptions matter; a model’s name alone doesn’t make it appropriate.
AnnaNow for continuous variables. These can take any value in an interval, or in a collection of intervals. Height, time until a component fails, and temperature measured on a continuous scale are examples.
MarcoAnd instead of assigning probabilities to individual values, a continuous distribution uses a probability density function. The density’s height at one point is not the probability of getting that exact value. To find a probability, we look at the area under the density curve across a range.
AnnaThat distinction is easy to muddle. If the probability of one exact value is zero, does that mean the variable can’t take that value?
MarcoNo. A continuous variable with a density has probability zero of taking any one exact value, but it still takes some value. A range can have positive probability. And the total area under the density curve, across all possible values, is one.
AnnaWhat do the common continuous distributions look like?
MarcoUniform gives equal density throughout an interval. Normal has a symmetric, bell-shaped density and is used for many measurements and errors. Exponential is often used for waiting times between events when the process has a constant event rate. Whether any of them fits depends on the situation and its assumptions.
AnnaSo we sum probabilities for discrete events, and find area for continuous ones. In either case, the probability of all possible outcomes is one. And we shouldn’t mistake density for probability, or assume a named model fits without checking its assumptions.
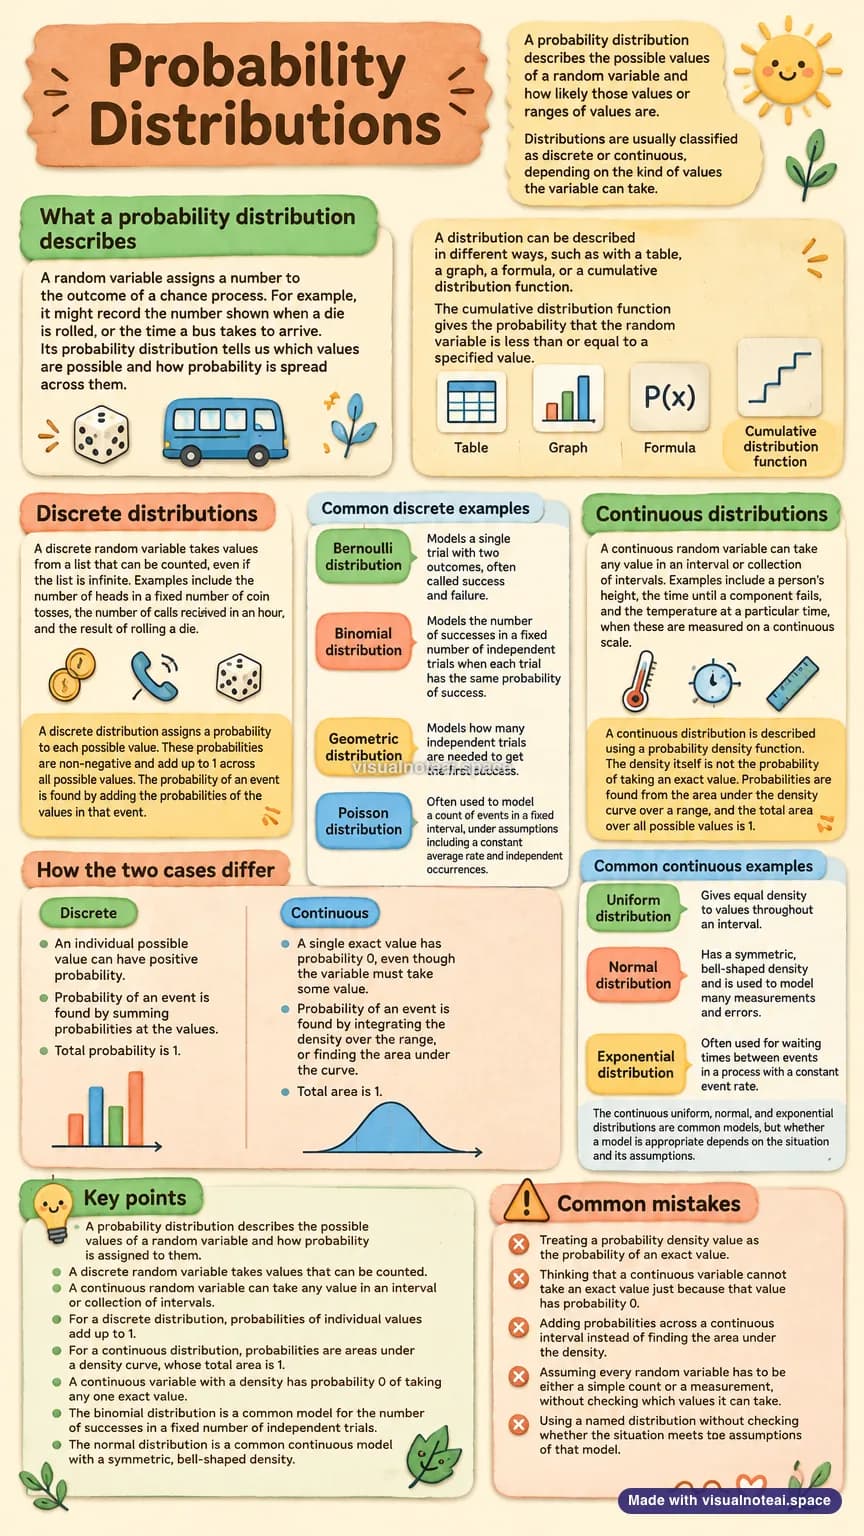
The whole topic on one page. Made with VisualNote.
!Common mistakes
- Treating a probability density value as the probability of an exact value.
- Thinking that a continuous variable cannot take an exact value just because that value has probability 0.
- Adding probabilities across a continuous interval instead of finding the area under the density.
- Assuming every random variable has to be either a simple count or a measurement, without checking which values it can take.
- Using a named distribution without checking whether the situation meets the assumptions of that model.
🧠Explore the map36 ideas
The mind map VisualNote made for this topic. Drag to pan, scroll to zoom.
- Probability Distributions
- Purpose and Representation
- Random variable: number assigned to a chance outcome
- Distribution: possible values and their probabilities
- Tables, graphs, and formulas
- Cumulative distribution function: P(X ≤ x)
- Discrete Distributions
- Countable possible values
- Probability assigned to each value
- Probabilities are non-negative and sum to 1
- Event probability: sum relevant values
- Bernoulli: one trial, success or failure
- Binomial: successes in fixed independent trials
- Same success probability per trial
- Geometric: trials until first success
- Poisson: event count in a fixed interval
- Constant average rate and independent events
- Continuous Distributions
- Any value in an interval or intervals
- Probability density function
- Range probability: area under density curve
- Total area equals 1
- Uniform: equal density across an interval
- Normal: symmetric, bell-shaped density
- Exponential: waiting times at a constant event rate
- Discrete and Continuous Comparison
- Discrete exact value can have positive probability
- Continuous exact value has probability 0
- Continuous ranges can have positive probability
- Discrete: sum; continuous: integrate density
- Model Choice and Common Mistakes
- Check model assumptions and situation
- Density height is not exact-value probability
- Probability zero does not mean impossible
- Use area, not summation, for continuous ranges
- Classify by possible values, not by labels like count or measurement
- Purpose and Representation
🃏Flashcards12 cards
- What does a probability distribution describe?
- It describes the possible values of a random variable and how probability is assigned to those values or ranges.
- What is a random variable?
- A random variable assigns a number to the outcome of a chance process.
- What is a cumulative distribution function (CDF)?
- It gives the probability that a random variable is less than or equal to a specified value.
- What is a discrete random variable?
- A discrete random variable takes values from a countable list, which may be finite or infinite.
- What rules apply to probabilities in a discrete distribution?
- Each probability is non-negative, and the probabilities of all possible values sum to 1. Event probabilities are found by adding the relevant values’ probabilities.
- What do the Bernoulli and binomial distributions model?
- Bernoulli models one trial with two outcomes. Binomial models the number of successes in a fixed number of independent trials with the same success probability.
- What do the geometric and Poisson distributions model?
- Geometric models the number of independent trials until the first success. Poisson often models event counts in a fixed interval when occurrences are independent and the average rate is constant.
- What is a continuous random variable?
- It can take any value in an interval or collection of intervals, such as a measured height or waiting time.
- How are probabilities found for a continuous distribution?
- A probability density function describes the distribution; probabilities over ranges are areas under its curve, and the total area is 1.
- What is the probability of an exact value for a continuous variable with a density?
- It is 0, although the variable still takes some value. A range of values can have positive probability.
- What are common continuous distributions and their uses?
- Uniform gives equal density across an interval; normal has a symmetric, bell-shaped density; exponential often models waiting times between events at a constant rate.
- How do you choose whether a named distribution is appropriate?
- Check that the situation meets the distribution’s assumptions. For discrete events, sum probabilities; for continuous ranges, integrate the density or find the area under its curve.
✅Test yourself5 questions
What does a cumulative distribution function give at a specified value x?
By definition, the cumulative distribution function at x is the probability that the variable is at most x.
For a continuous random variable described by a density, what is the probability of taking one exact value?
A single exact value has zero area under a continuous density, so its probability is zero.
How is the probability that a continuous variable lies in an interval found from its density?
The probability over an interval is the integral of the density there, which is the area under its curve.
Which situation matches the usual binomial model?
A binomial variable counts successes across a fixed number of independent trials with a common success probability.
How do you find the probability of an event for a discrete random variable when the event includes several possible values?
For a discrete variable, the probability of an event is the sum of the probabilities of its included values.
📝The notes
What a probability distribution describes
A random variable assigns a number to the outcome of a chance process. For example, it might record the number shown when a die is rolled, or the time a bus takes to arrive. Its probability distribution tells us which values are possible and how probability is spread across them.
A distribution can be described in different ways, such as with a table, a graph, a formula, or a cumulative distribution function. The cumulative distribution function gives the probability that the random variable is less than or equal to a specified value.
Discrete distributions
A discrete random variable takes values from a list that can be counted, even if the list is infinite. Examples include the number of heads in a fixed number of coin tosses, the number of calls received in an hour, and the result of rolling a die.
A discrete distribution assigns a probability to each possible value. These probabilities are non-negative and add up to 1 across all possible values. The probability of an event is found by adding the probabilities of the values in that event.
Common discrete examples
The Bernoulli distribution models a single trial with two outcomes, often called success and failure. The binomial distribution models the number of successes in a fixed number of independent trials when each trial has the same probability of success.
The geometric distribution models how many independent trials are needed to get the first success. The Poisson distribution is often used to model a count of events in a fixed interval, under assumptions including a constant average rate and independent occurrences.
Continuous distributions
A continuous random variable can take any value in an interval or collection of intervals. Examples include a person's height, the time until a component fails, and the temperature at a particular time, when these are measured on a continuous scale.
A continuous distribution is described using a probability density function. The density itself is not the probability of taking an exact value. Probabilities are found from the area under the density curve over a range, and the total area over all possible values is 1.
Common continuous examples
The uniform distribution on an interval gives equal density to values throughout that interval. The normal distribution has a symmetric, bell-shaped density and is used to model many measurements and errors.
The exponential distribution is often used for waiting times between events in a process with a constant event rate. The continuous uniform, normal, and exponential distributions are common models, but whether a model is appropriate depends on the situation and its assumptions.
How the two cases differ
For a discrete variable, an individual possible value can have positive probability. For a continuous variable with a density, the probability of any one exact value is 0, even though the variable must take some value. A range of values can still have positive probability.
The probability of a discrete event is found by summing probabilities at the relevant values. The probability of a continuous event is found by integrating the density over the relevant range, or equivalently by finding the area under its curve. In both cases, the probability of the entire set of possible outcomes is 1.
Make this for your own notes
Paste a chapter or a PDF and get the sheet, map, cards, quiz and episode back in about a minute. No credit card.