The smartest students you know aren't reading faster. They're encoding less, and remembering more. Visual notes — sketchnotes, mind maps, concept diagrams — beat highlighters and re-reading on every metric that matters at exam time. This guide is the why and the how.
The science behind visual notes
The dual-coding theory developed by Allan Paivio in the 1970s says the brain stores verbal and visual information through separate but interconnected channels. When information is encoded both ways, you get two retrieval paths instead of one. Studies consistently show that students who combine words and images during note-taking score 25–40% higher on delayed recall tests than students using text-only notes.
A 2020 meta-analysis in Educational Psychology Review found that visual note-taking strategies — sketchnotes, mind maps, concept maps — produce moderate-to-large effect sizes on learning outcomes across STEM, humanities, and language subjects. The mechanism isn't magic: you're forced to think about which ideas matter and how they connect.
Visual note-taking produces moderate-to-large effect sizes on recall across every subject we tested.
— Educational Psychology Review, 2020
Why typed lecture notes fail at exam time
Most students type notes verbatim during lectures because it feels productive. The problem: typing fast disables the filtering process. You end up with 8 pages of dense text that mostly mirror the lecture slides — useful as a reference, useless as a study aid. Two weeks later, scrolling through them feels like reading someone else's notes.
Visual notes invert that. The page is finite. You have to choose what fits. That single act of compression is where learning actually happens. The visual is then the recall trigger: looking at it brings back the rest of the lecture as context.

“But I can't draw” — why that no longer matters
The classic objection to sketchnoting was always “I can't draw.” AI removes that bottleneck completely. Tools like VisualNote AI take your existing typed notes — or a chapter from a textbook PDF — and generate a sketchnote-style visual for you. You provide the thinking; the AI handles the rendering. The output looks hand-drawn because the underlying image model is trained on hand-drawn references.
The 5-minute workflow for any subject
Take rough notes live
Bullet points, full sentences, whatever — capture the key arguments and any examples. Format doesn't matter.
Summarise within 24h
500–1500 words, from memory first, then fill gaps from slides. This is the active-recall step that does the real learning.
Paste into VisualNote AI
Pick Classic for general topics, Timeline for history or processes, Blueprint for STEM diagrams.
Generate + download
20–40 seconds and you have a sketchnote of the lecture. Save it to your revision folder.
Review by glancing
The biggest win: 5 seconds per visual instead of 5 minutes per page. The image triggers the underlying memory.
Best subjects for visual notes
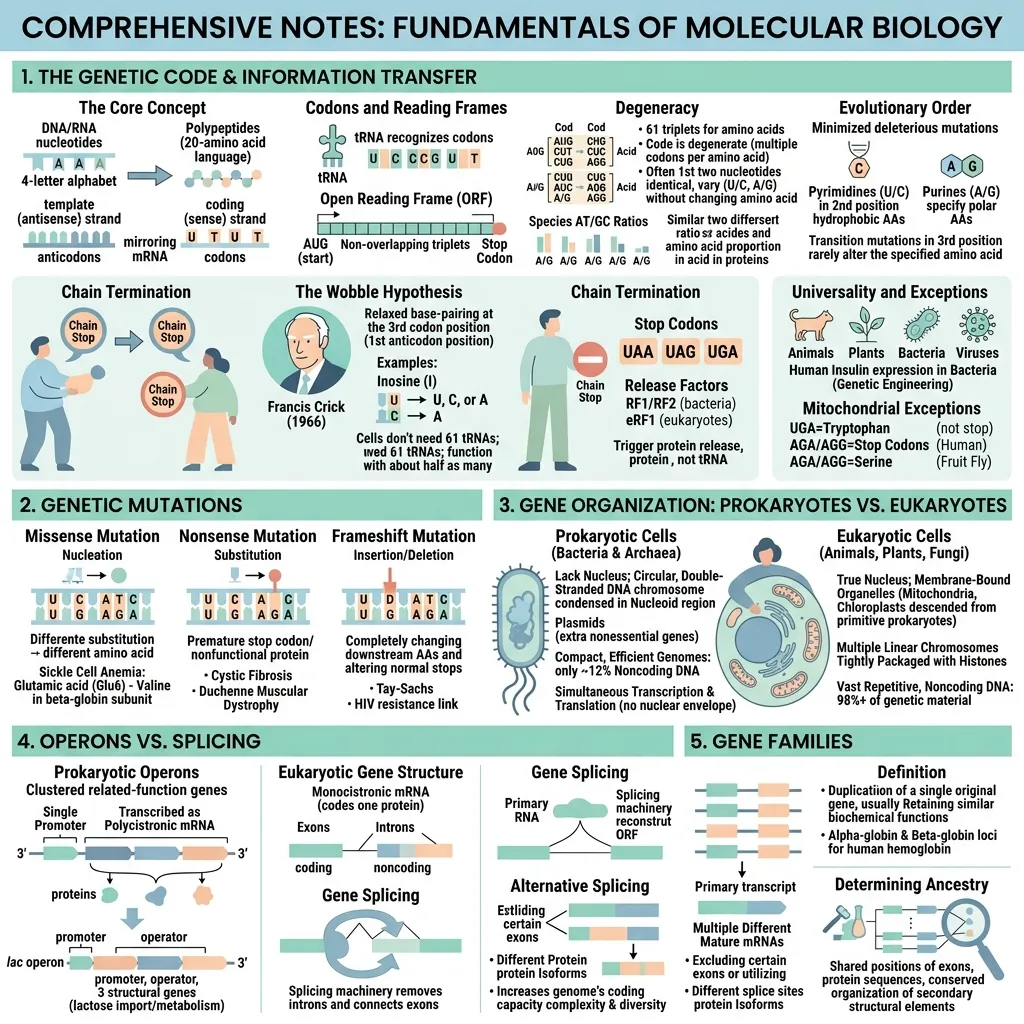
- Biology — pathways, cycles, anatomy structures
- History — timelines, cause-and-effect chains, key figures
- Law — case summaries, principles, exception trees
- Medicine — diagnostic flowcharts, drug mechanisms
- Philosophy — argument maps, thinker comparisons
- Computer science — algorithms, system architectures (Blueprint style)
- Languages — verb conjugations, semantic fields, grammar rules
See more in our student use cases.
Frequently asked questions
Is visual note-taking better than Cornell?
They solve different problems. Cornell wins live during lectures; visual notes win afterwards for review. Most strong students use both.
Do I need an iPad or stylus?
No. The whole point of using AI is that you can type plain notes from any device and get a visual back.
How many visuals per course?
Roughly one per major topic. A 12-week course usually maps to 8–15 visuals — enough to flip through during the final week.
Is there a free plan for students?
Yes — free generations every month. Plus is $10.99/month with student-friendly limits. See pricing.
Related: complete sketchnote infographic guide.


