
The Green Revolution in India — Infographic & Visual Notes
Three pages of dense textbook paragraphs about India's Green Revolution, rebuilt as a single sketchnote-style infographic you can revise in one glance — and recreate from your own class notes.
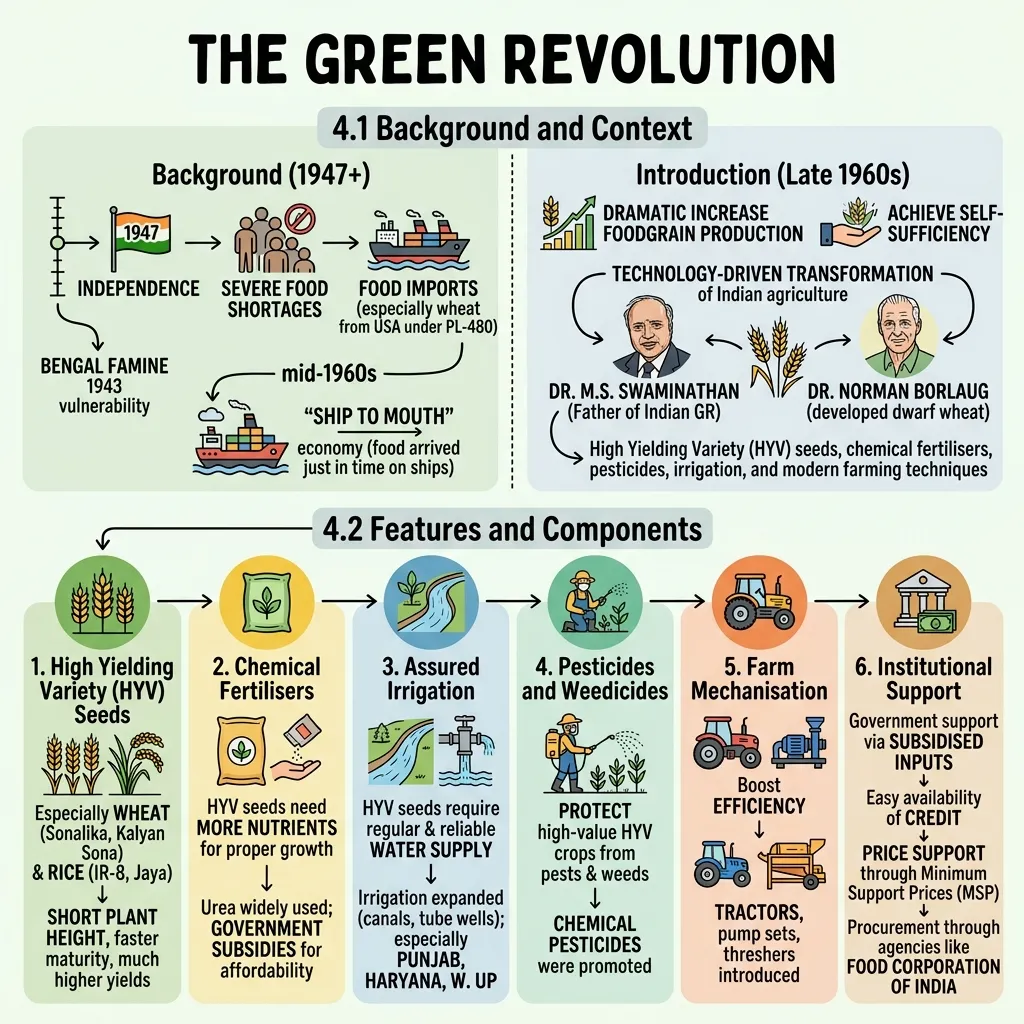
4.1 Background and Context. After independence in 1947, India faced severe food shortages and depended on food imports, especially wheat from the USA under PL-480. The Bengal Famine of 1943 had already shown the vulnerability of India's food system, and by the mid-1960s the country was described as a 'ship to mouth' economy. Against this backdrop the Green Revolution was introduced in the late 1960s to raise foodgrain production and achieve self-sufficiency. 4.2 Features and Components. (1) High Yielding Variety (HYV) seeds for wheat and rice. (2) Chemical fertilisers, promoted with government subsidies. (3) Assured irrigation through canals and tube wells. (4) Pesticides and weedicides. (5) Farm mechanisation with tractors and threshers. (6) Institutional support: subsidised inputs, credit and Minimum Support Prices.
What's in this visual
The Green Revolution is one of the most testable topics in Indian social science and economics — and one of the hardest to revise from plain notes, because it is really a chain of causes, inputs and outcomes. The infographic above takes the same syllabus content and lays it out as a story: the crisis, the response, and the six moving parts. Here is the full breakdown.
What the Green Revolution was
The Green Revolution was a technology-driven transformation of Indian agriculture from the late 1960s onward, concentrated on wheat and rice. It combined High Yielding Variety (HYV) seeds with chemical fertilisers, pesticides, reliable irrigation and modern farming techniques to dramatically raise foodgrain output. It is usually associated with Dr M.S. Swaminathan, called the Father of the Indian Green Revolution, who built on the dwarf wheat varieties developed in Mexico by Dr Norman Borlaug.
Why India needed it — the 1947 food crisis
After independence in 1947 India could not feed itself. It relied on imported wheat from the USA under the PL-480 programme, and the memory of the 1943 Bengal Famine showed how fragile the food system was. By the mid-1960s economists described India as a 'ship to mouth' economy — grain was consumed almost as fast as ships could deliver it. The Green Revolution was the deliberate policy response: a national push for food self-sufficiency.
The six components that made it work
The syllabus breaks the Green Revolution into six components, and this is exactly where a visual helps. HYV seeds (wheat varieties like Sonalika and Kalyan Sona; rice varieties like IR-8 and Jaya) had shorter stems, faster maturity and far higher yields. Chemical fertilisers such as urea were needed because HYV seeds are nutrient-hungry, and were made affordable through subsidies. Assured irrigation from canals and tube wells supplied the reliable water HYV seeds require. Pesticides and weedicides protected the high-value crops. Farm mechanisation — tractors, pump sets, threshers — raised efficiency. Institutional support tied it together: subsidised inputs, easy credit, Minimum Support Prices and government procurement through the Food Corporation of India.
The people and places behind it
The Green Revolution was led in India by Dr M.S. Swaminathan, with the dwarf wheat science of Dr Norman Borlaug behind it. Geographically it was concentrated in Punjab, Haryana and western Uttar Pradesh — the states with the irrigation infrastructure to support HYV seeds. The who and the where are common short-answer questions, and pinning names and regions to a map or portrait in a visual makes them far easier to recall.
Why this topic is perfect for a visual
Plain notes force you to re-read the whole causal chain every time. A one-page infographic lets you see it: famine and import dependence on one side, the six components branching out on the other. For revision you glance at the structure and the detail comes back. That is the difference between reading your notes and actually remembering them.
For teachers
The problem
- The Green Revolution spans causes, six components and consequences — too much to fit on a chalkboard cleanly.
- Students memorise the six components as a flat list and lose the cause-and-effect logic connecting them.
- Building a clear handout or slide for the topic by hand takes an evening you do not have.
How to use it in class
- Hand it out as a one-page revision sheet before the unit test.
- Project it as a lesson opener and unpack one component at a time.
- Use the before/after contrast to teach students how to compress their own notes.
- Drop it into a worksheet with the six components blanked out as a recall exercise.
For students & visual learners
The problem
- Textbook chapters on the Green Revolution are dense, and every sentence feels examinable.
- You can list the six components but freeze when asked to explain how they connect.
- Names, seed varieties and states blur together the night before the exam.
How to use it to study
- Revise the whole topic in one glance instead of re-reading three pages.
- Use the branching layout to recall the six components in order.
- Stick it above your desk so the structure sinks in passively.
- Generate one visual per chapter and flip through them all in exam week.
Make your own visual like this
Paste your notes or upload a PDF
Drop in your own class notes, a textbook chapter or a PDF. Any subject, any language.
Pick a visual style
Choose a sketchnote, infographic or diagram style that fits the topic.
Generate and download
In about 15–40 seconds you get a one-page visual you can print, share or revise from.
Frequently asked questions
Who is called the Father of the Indian Green Revolution?
Dr M.S. Swaminathan, who led the introduction of High Yielding Variety seeds and modern techniques in India. He built on the dwarf wheat varieties developed in Mexico by Dr Norman Borlaug.
What are the six components of the Green Revolution?
HYV seeds, chemical fertilisers, assured irrigation, pesticides and weedicides, farm mechanisation, and institutional support such as subsidies, credit and Minimum Support Prices.
Can I turn my own history notes into an infographic like this?
Yes — that is exactly what VisualNote AI does. Paste your notes or upload a textbook PDF, pick a style, and you get a sketchnote-style visual in seconds. Try the notes-to-visual generator.
More visual examples


Turn your notes into a visual
Paste any notes or upload a PDF and get a sketchnote-style visual in under a minute.