
Municipal Audit Diagnostic — Visual Report Summary
A long financial-compliance report on nine municipalities, distilled into a single visual of performance tiers and recommended interventions.
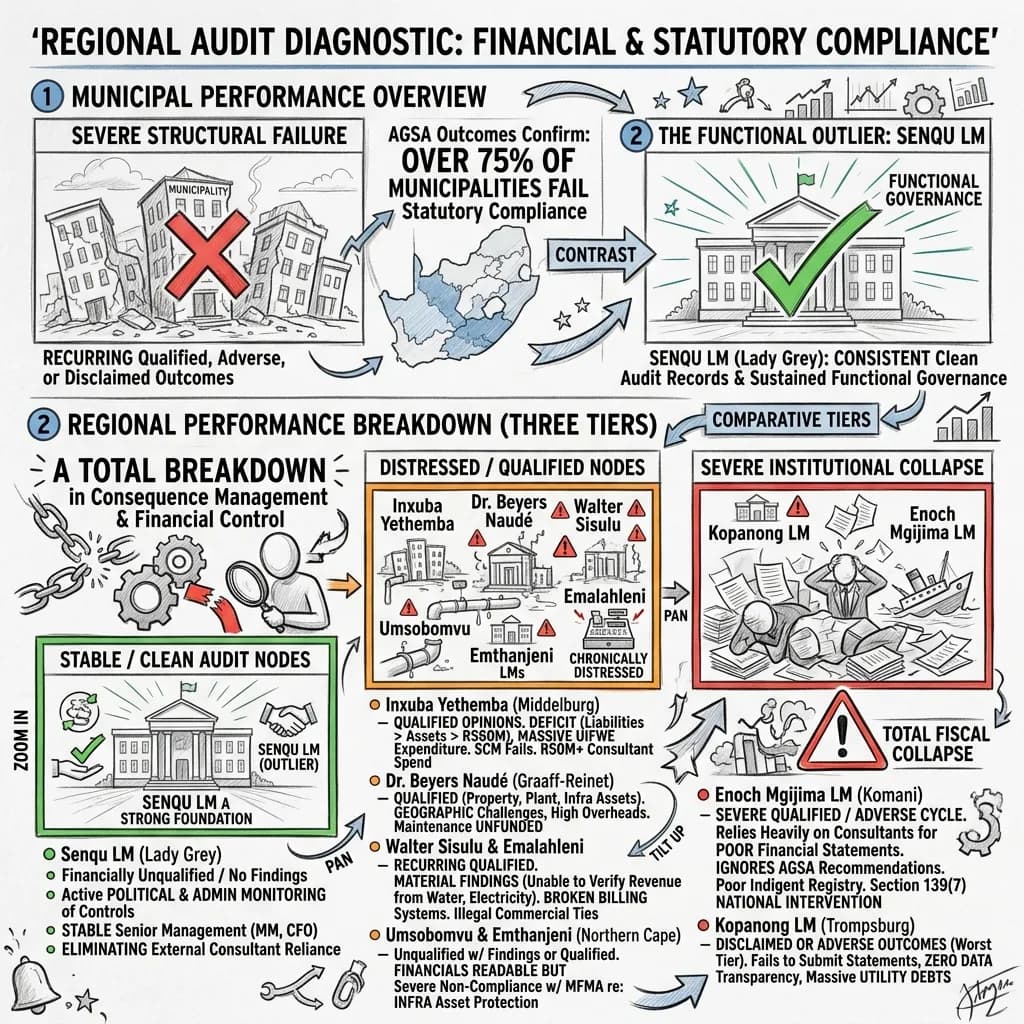
Regional audit diagnostic of financial and statutory compliance. Auditor-General of South Africa outcomes for nine municipalities confirm severe structural failure, with over 75% failing basic statutory compliance and returning qualified, adverse or disclaimed outcomes. The region splits into three performance tiers. Senqu is the sole outlier, sustaining clean audits with stable senior management and no reliance on external consultants. Distressed nodes include Inxuba Yethemba, Dr Beyers Naude, Walter Sisulu, Emalahleni, Umsobomvu and Emthanjeni, with deficits, unreliable billing and large unauthorised, irregular, fruitless and wasteful expenditure. Enoch Mgijima and Kopanong represent total collapse, with disclaimed outcomes and Section 139 intervention. Core breaches: MFMA Section 62 internal controls, supply chain management abuse, fruitless consultant spend. Recommended interventions: shift procurement to National Treasury transversal contracts, enforce MFMA Section 171 misconduct charges, and replicate the Senqu governance model.
What's in this visual
An audit diagnostic of this kind is information-dense by design — nine institutions, three performance tiers, a stack of statutory references and a set of recommendations, all in continuous prose. The visual above does what a good summary should: it sorts the institutions, names the breaches, and lays the recommended fixes alongside the problems they address. Here is the full breakdown.
What the audit diagnostic covers
The report is a regional audit diagnostic assessing the financial and statutory compliance of nine local municipalities, drawing on outcomes from the Auditor-General of South Africa (AGSA). Its headline finding is blunt: more than 75% of the municipalities fail to maintain basic statutory compliance, returning recurring qualified, adverse or disclaimed audit opinions. The diagnostic is not just a scorecard — it identifies the structural causes of failure and ends with concrete interventions, which makes it a useful worked example of how a public-sector compliance report is built and read.
The three performance tiers
The diagnostic sorts the nine municipalities into three performance tiers, and this grouping is the backbone of the whole report. The stable tier holds a single clean-audit municipality. The distressed tier contains six municipalities with qualified opinions and material findings — readable financial records, but serious non-compliance. The collapse tier holds two municipalities in adverse or disclaimed territory, the worst category of municipal failure. Tiering is exactly the kind of structure that drowns in prose: a visual sorts the institutions into three labelled columns so the distribution of failure is obvious at a glance.
The clean-governance outlier
Senqu Local Municipality is the report's single outlier — the one institution sustaining a clean audit, meaning financially unqualified with no findings. The diagnostic is specific about why. Its political and administrative leadership actively monitor internal controls and preventative measures, and the key senior posts — Municipal Manager and Chief Financial Officer — remain stable rather than vacant. That stability removes the reliance on expensive external consultants that defines the failing municipalities. Senqu matters in the report precisely because it proves the failures elsewhere are a governance choice, not an inevitability.
Core statutory breaches flagged
The diagnostic ties failure to three recurring statutory breaches. First, violation of MFMA Section 62 — almost every municipality fails to maintain working internal financial controls, which is what drives the escalating balances of unauthorised, irregular, fruitless and wasteful expenditure (UIFWE). Second, abuse of supply chain management regulations: contracts awarded without competitive bidding or conflict-of-interest declarations, triggering Special Investigating Unit probes. Third, fruitless consultant expenditure — distressed municipalities pay heavily for private financial consultants whose statements still contain material misstatements.
The strategic interventions recommended
The report does not stop at diagnosis; it pairs each problem with a strategic intervention. To curb procurement abuse, it recommends stripping supply chain powers from the worst nodes and routing infrastructure spend through National Treasury transversal contracts. To address financial misconduct, it calls for invoking MFMA Section 171 to suspend and criminally prosecute non-compliant accounting officers. And to lift the distressed tier, it recommends replicating the Senqu model — deploying its internal audit toolkits as a regional blueprint. Each fix maps directly onto a flagged breach.
Why long reports work better as visual summaries
A compliance report is read for decisions, not for pleasure — yet its key structure is buried in pages of qualified, careful prose. A visual summary surfaces that structure: which institutions sit in which tier, which breach drives which figure, which intervention answers which problem. For a professional, that turns an hour of reading into a briefing that fits on one screen. For a public-administration student, it makes the architecture of an audit report — finding, cause, recommendation — visible and learnable.
For teachers
The problem
- Public-finance reports are written in cautious, technical prose, so the underlying structure of finding-cause-fix is hard for students to extract.
- Learners can define a qualified or disclaimed audit opinion but struggle to see how nine institutions compare across one region.
- Statutory references such as MFMA Sections 62 and 171 stay abstract until they are tied to a real consequence.
How to use it in class
- Use it as a teaching case for how an audit report is organised, from outcome to root cause to recommendation.
- Project the three tiers and ask students to argue which factors push a municipality from one tier to the next.
- Pair each statutory breach with its matching intervention to show how diagnosis drives remedy.
- Set a comparison task: contrast the clean-audit outlier against a collapsed municipality point by point.
For students & visual learners
The problem
- Dense governance reports are slow to read, and it is hard to tell which sentences carry the actual findings.
- Audit terminology — UIFWE, transversal contracts, disclaimed opinions — is easy to mix up without a reference in view.
- You can summarise one municipality but lose the regional picture across all nine.
How to use it to study
- Use it as a model for how to compress a long report down to tiers, causes and actions.
- Keep it open while reading the full report so each section maps onto a place in the structure.
- Revise the audit-opinion vocabulary against concrete municipalities rather than dictionary definitions.
- Practise the same compression on a different report and check your version against this one.
Make your own visual like this
Paste your notes or upload a PDF
Drop in your own class notes, a textbook chapter or a PDF. Any subject, any language.
Pick a visual style
Choose a sketchnote, infographic or diagram style that fits the topic.
Generate and download
In about 15–40 seconds you get a one-page visual you can print, share or revise from.
Frequently asked questions
Can VisualNote AI summarise a long report, not just study notes?
Yes. This page itself was built from a dense regional audit report, not classroom notes. Upload a report as a PDF and VisualNote AI extracts the structure — tiers, findings, recommendations — into a single visual summary. Try the PDF-to-infographic tool.
What kinds of documents can it turn into a visual?
Study notes, textbook chapters, research papers, lecture slides, compliance and audit reports, whitepapers and meeting documents all work. Anything that is structured information trapped in long prose can be rebuilt as a one-page visual summary.
Is the original report content kept private?
Yes. Your uploaded documents are used only to generate your visual and are not published or shared. The summary you receive is yours to keep, print or circulate as you choose.
More visual examples


Turn your notes into a visual
Paste any notes or upload a PDF and get a sketchnote-style visual in under a minute.