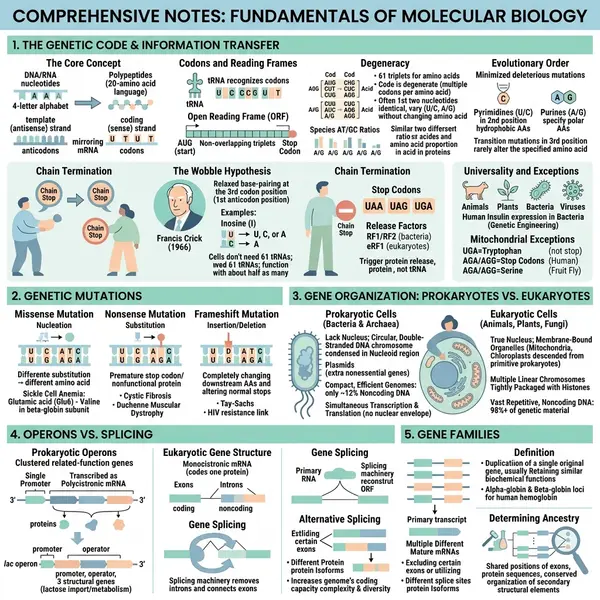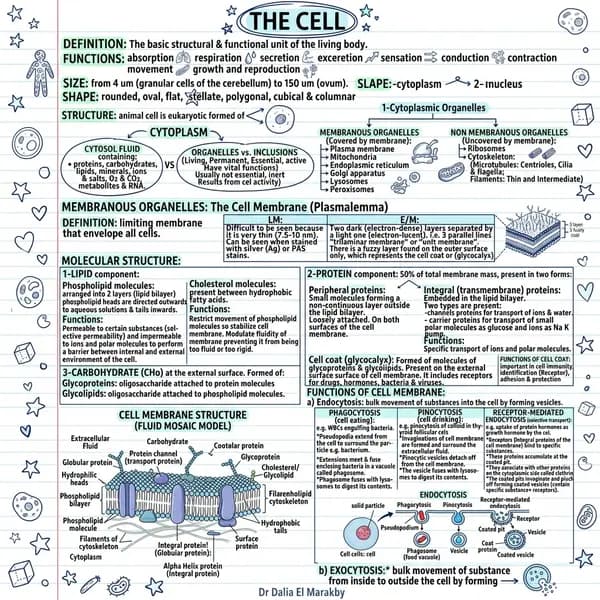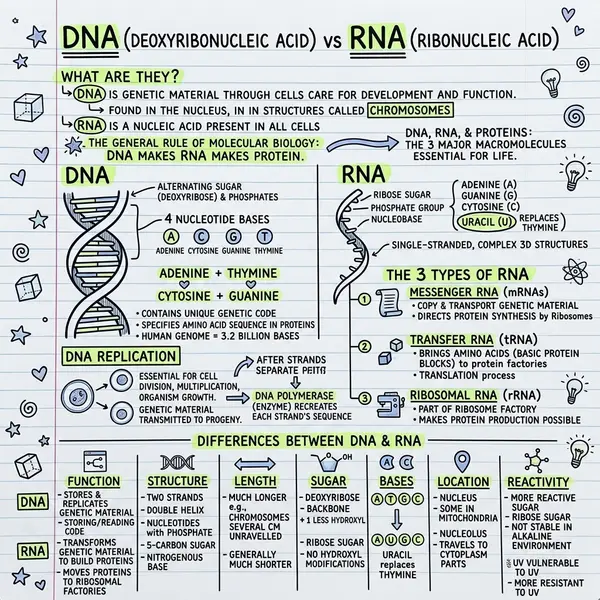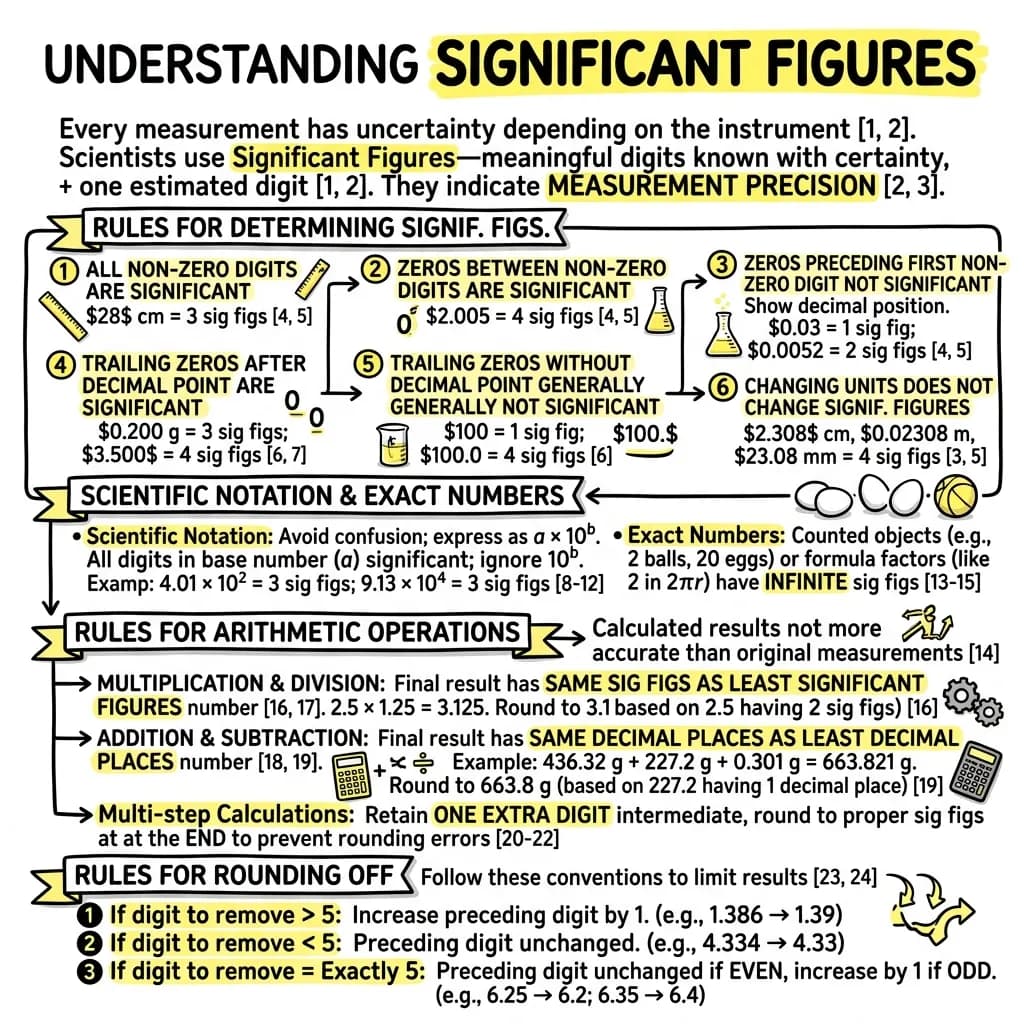
Dense PDFs are a communication bottleneck. The information is there, the format makes it inaccessible — most people skim the abstract, glance at the conclusion, close the file. A one-page visual summary fixes that, and AI now generates one faster than you can finish your coffee.
Why PDFs need visual summaries
Research consistently shows people retain visual information better than text and process it significantly faster. A one-page infographic can communicate what takes 20 pages to explain in full. The historical problem was creation time — making one used to take an hour in a design tool. AI changes that entirely.
What you need
- A PDF file (up to 10MB) — research paper, report, textbook chapter
- A VisualNote AI Plus account ($13.99/month) — PDF upload is a Plus feature
- About 30 seconds
The five steps
Log in
Go to visualnoteai.space and sign in. You'll need Plus to access PDF upload — start a free trial or upgrade from the pricing page.
Pick PDF upload mode
In the generation interface, switch to the PDF/document tab. You'll see an upload area.
Upload your PDF
Drag and drop or browse. Up to 10MB. The file is processed by OpenAI, which reads and understands the full content.
Choose a visual style
Classic for reports and papers. Timeline for processes and sequences. Blueprint for technical documents.
Generate + download
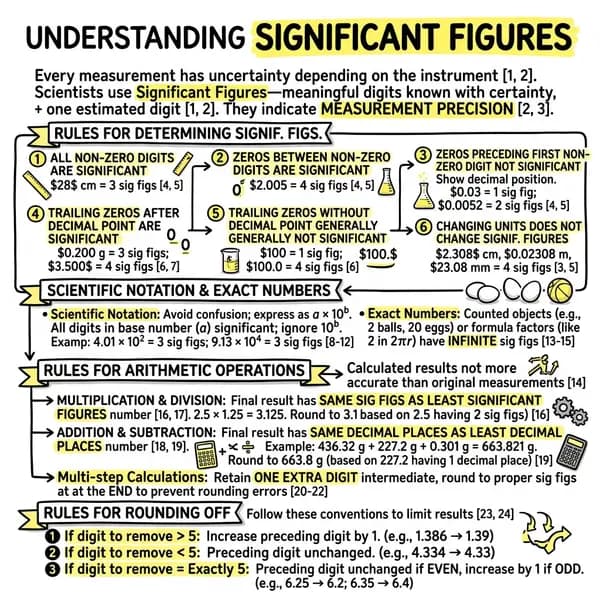
Click Generate. Under 30 seconds. Download the PNG and share — Slack, email, presentation, social.
Tips for better results
- Use text-based PDFs. Scans of printed pages don't extract as accurately. OCR first if you have to.
- Choose your style intentionally. Classic for reports, Timeline for processes, Kanban for comparisons, Blueprint for technical.
- For very large documents, upload a focused section rather than the full file — a more targeted result.
- If the first result misses something, try a different style. The same content often looks completely different in Classic vs Blueprint.
Frequently asked questions
Is my PDF stored on your servers?
No. Documents are processed through serverless endpoints and not stored permanently.
What's the file size limit?
PDFs up to 10MB on the Plus plan.
Can the free plan upload PDFs?
PDF upload is a Plus feature. The free plan supports text-to-visual generation from pasted text.
More questions? See the full FAQ page.