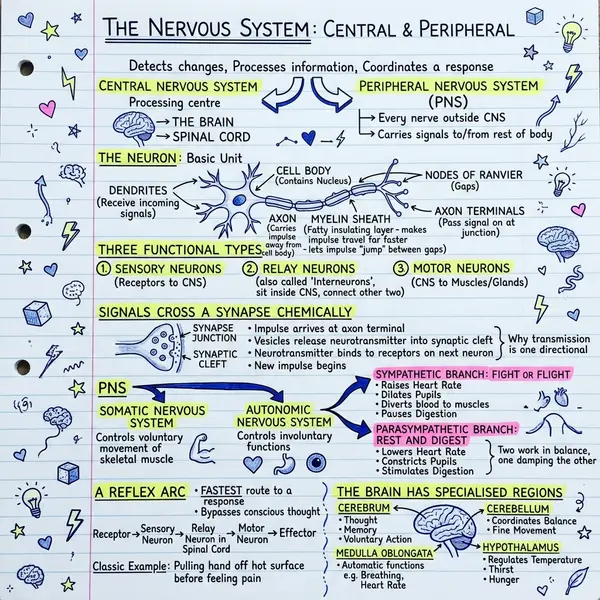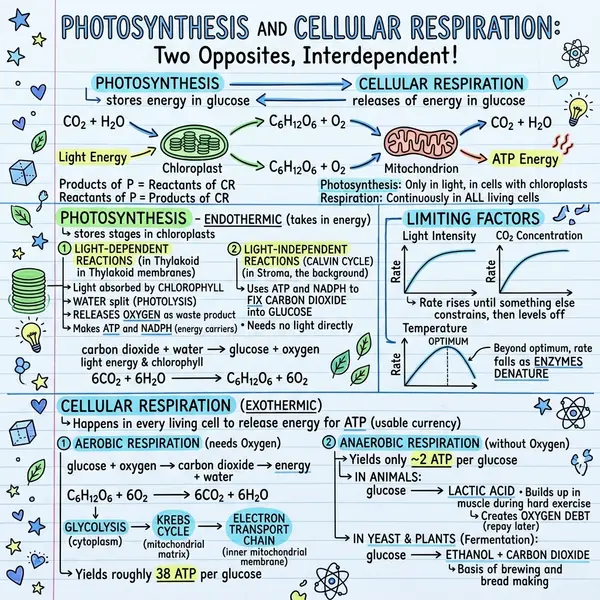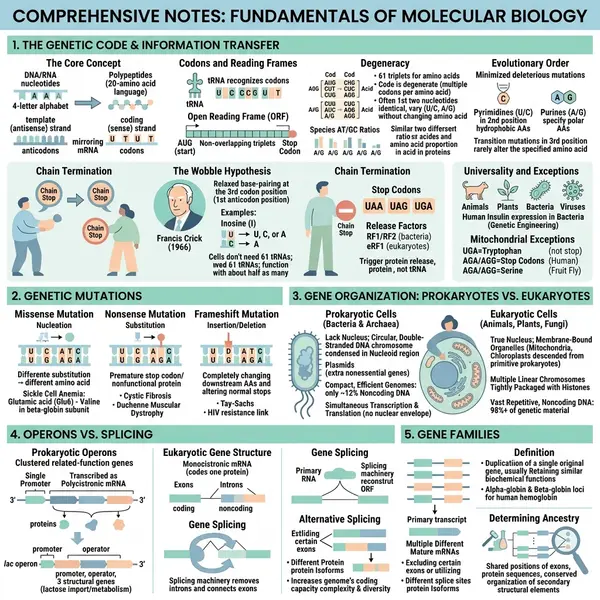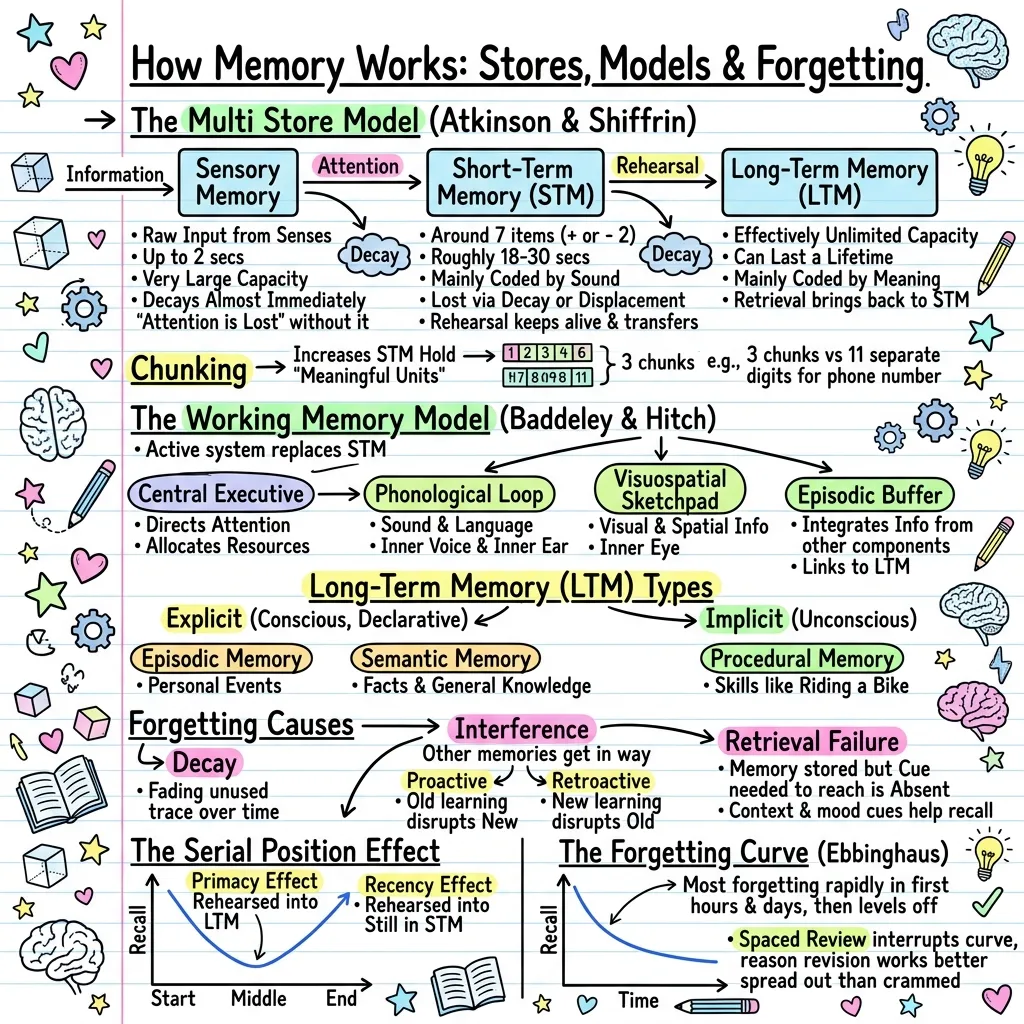
Linear notes are the default: lines of text, top to bottom, in the order the lecturer spoke. Visual notes rearrange the same content into space: diagrams, maps, sketchnotes. The question is whether the rearranging is worth the effort. There is enough research to give a straight answer, with numbers.
Words plus pictures beat words alone
The most cited result comes from Richard Mayer's lab. Across 13 experimental comparisons, students who learned from words and graphics did much better on transfer tests than students who learned from words alone, with a median effect size of d = 1.35 (Mayer, 2021, Multimedia Learning, 3rd edition). That is a very large effect, and it comes with context: short lessons, immediate tests, mostly beginners, one lab.
Independent numbers are smaller and probably closer to what you will see in real life. Guo and colleagues (2020) pooled 39 experiments and found that adding graphics to text improved reading comprehension by g = 0.39, at every grade level. Cromley and Chen (2025) re-analysed 181 of Mayer's own studies and found an overall g = 0.37, with text plus diagrams among the most consistent effects. Moderate, reliable, not magic.
Maps: making one beats reading one
Concept maps and mind maps are the most studied form of visual notes. Nesbit and Adesope (2006) analysed 55 studies with 5,818 participants and found that using concept maps was associated with better retention. The update by Schroeder and colleagues (2018), with 142 effect sizes and 11,814 participants, put the overall effect at g = 0.58 and split it in a useful way: creating a map gave g = 0.72, studying a finished one gave g = 0.43. Both beat text. Building wins.
Where linear notes still win
- During a fast lecture. You cannot design a diagram at speaking speed. Capture linearly, restructure afterwards.
- For arguments and proofs. When the order of steps is the content, a sequence of lines is the right shape.
- When time is short. Drawing is slow. In one 2024 experiment, writing summaries beat drawing for undergraduates on an online lesson (Lawson and Mayer).
- Pictures are remembered well, not understood automatically. Classic work by Shepard (1967) showed very high recognition for pictures, but recognising an image is not the same as explaining a concept.
A practical split
Linear in the lecture
Write or type in order. Do not try to be tidy. The goal is capture.
Visual within a day
Turn each topic into one page: a map, a diagram, a sketchnote. Decide what the three or four main ideas are and how they connect. This is the g = 0.72 activity.
Use a generated visual as a draft, not a finish line
An AI visual gets you the g = 0.43 benefit of a ready-made map in seconds. To get the rest, correct it, add what it missed, and redraw the skeleton from memory.
Retrieve
Flashcards or a quiz on the same material, spaced over days.
That third step is where our text to visual tool fits. Paste the linear notes, get the page, then ask the chat to add what is missing. If you want a map instead of a drawn page, the mind map generator works from the same notes.
Frequently asked questions
Are visual notes better than linear notes?
For understanding and remembering structured material, yes, by a moderate margin: meta-analyses put the benefit of adding graphics at about g = 0.4, and of building your own map at about g = 0.7. For capturing a fast lecture or following an argument, linear notes are the better tool.
I am not a visual learner. Should I bother?
Yes. Studies find that learning style labels do not predict who benefits from visuals. In Cuevas and Dawson (2018), imagery helped all students regardless of their stated style.
Is a mind map better than a sketchnote?
Mind maps have far more research behind them. Sketchnotes have almost no controlled studies yet, though they rest on the same principles: words plus pictures, and spatial structure. Pick the form that fits the content.
Does an AI-generated visual count?
It counts as studying a provided visual, which helps (g = 0.43 for ready-made maps). It does not replace making one. Edit it and redraw the core from memory to get the larger benefit.