
A titration curve shows how the pH of a solution changes as a titrant is added. Its starting pH, gradual regions, steep change, and equivalence point help identify the acid and base involved and the reaction’s stoichiometry.
★What to remember
- A titration curve plots pH against the volume of titrant added.
- Adding base to acid generally raises pH, and adding acid to base generally lowers it.
- The equivalence point is where reactants have combined in the stoichiometric proportions in the balanced equation.
- For a strong acid and strong base, the equivalence pH is about 7 at 25 degrees Celsius.
- A weak acid with a strong base has an equivalence pH above 7, while a strong acid with a weak base has one below 7.
- The steep region indicates where a small volume change causes a large pH change, and its middle estimates the equivalence point.
- At the half equivalence point for a weak acid titrated with a strong base, pH equals pKa.
🎧Listen3:21 · transcript
AnnaWhen you hear “titration curve,” what do you picture?
MarcoA graph of pH against the volume of titrant added. The solution being analysed sits in the flask, and titrant is added gradually from a burette. The curve shows how the pH responds as the reaction proceeds.
AnnaAnd the direction tells us something right away, doesn’t it? Add base to acid, and pH generally rises. Add acid to base, and it generally falls. But why isn’t the curve a straight line?
MarcoBecause pH depends on hydrogen ion or hydroxide ion concentrations, and those change as the reaction proceeds. The curve also depends on whether the acid and base are strong or weak, and on their concentrations.
AnnaSo what does the start of the curve tell us?
MarcoAt first, the pH is mainly set by the solution in the flask. A strong acid usually starts low, and a strong base starts high. Weak acids and bases are only partly ionised, so at the same concentration their starting pH values are usually less extreme.
AnnaWhat happens in that gentler region before equivalence?
MarcoThe titrant reacts with the substance in the flask. Take a weak acid titrated with a strong base. For much of that region, both the weak acid and its conjugate base are present. That makes a buffer, so the pH changes gradually.
AnnaAnd there’s a useful point halfway to equivalence. What’s special about it?
MarcoAt the half equivalence point, the weak acid and conjugate base have equal concentrations. The pH equals the acid’s pKa.
AnnaThen we reach the steep section. Does the equivalence point always mean pH seven?
MarcoNo. Equivalence means the acid and base have reacted in the proportions given by the balanced equation. It’s a stoichiometric point, not a fixed pH. A strong acid with a strong base has an equivalence pH of about seven at twenty-five degrees Celsius.
AnnaAnd the weak-acid case shifts above seven, right? Why?
MarcoYes. With a weak acid and strong base, the conjugate base formed reacts with water to produce hydroxide ions, so equivalence is above seven. With a strong acid and weak base, the conjugate acid produces hydrogen ions, so it’s below seven.
AnnaWhat about after equivalence?
MarcoThe titrant is now in excess, so it has the greatest effect on pH. Extra strong base makes the solution alkaline; excess acid makes it acidic. And with a weak acid and weak base, there’s no single predictable equivalence pH just from calling them weak. Their relative strengths, represented by Ka and Kb, matter, as do the titration conditions.
AnnaWhen we read the steep region, how do we distinguish equivalence from the indicator endpoint?
MarcoThe middle of the steep vertical region helps estimate equivalence, because a small volume addition causes a large pH change. An indicator’s colour change is the endpoint. It’s an experimental estimate, and it works best when its colour-change range falls within that steep region.
AnnaAnd once we have the equivalence volume, can we calculate an unknown concentration?
MarcoYes. Use that volume with the balanced equation and its mole ratio to relate the titrant to the substance in the flask. Don’t assume equal volumes are needed. Concentrations and the reaction’s coefficients determine the volumes. So the pH at equivalence tells us about the solution’s character; the equivalence volume tells us how much titrant reacted.
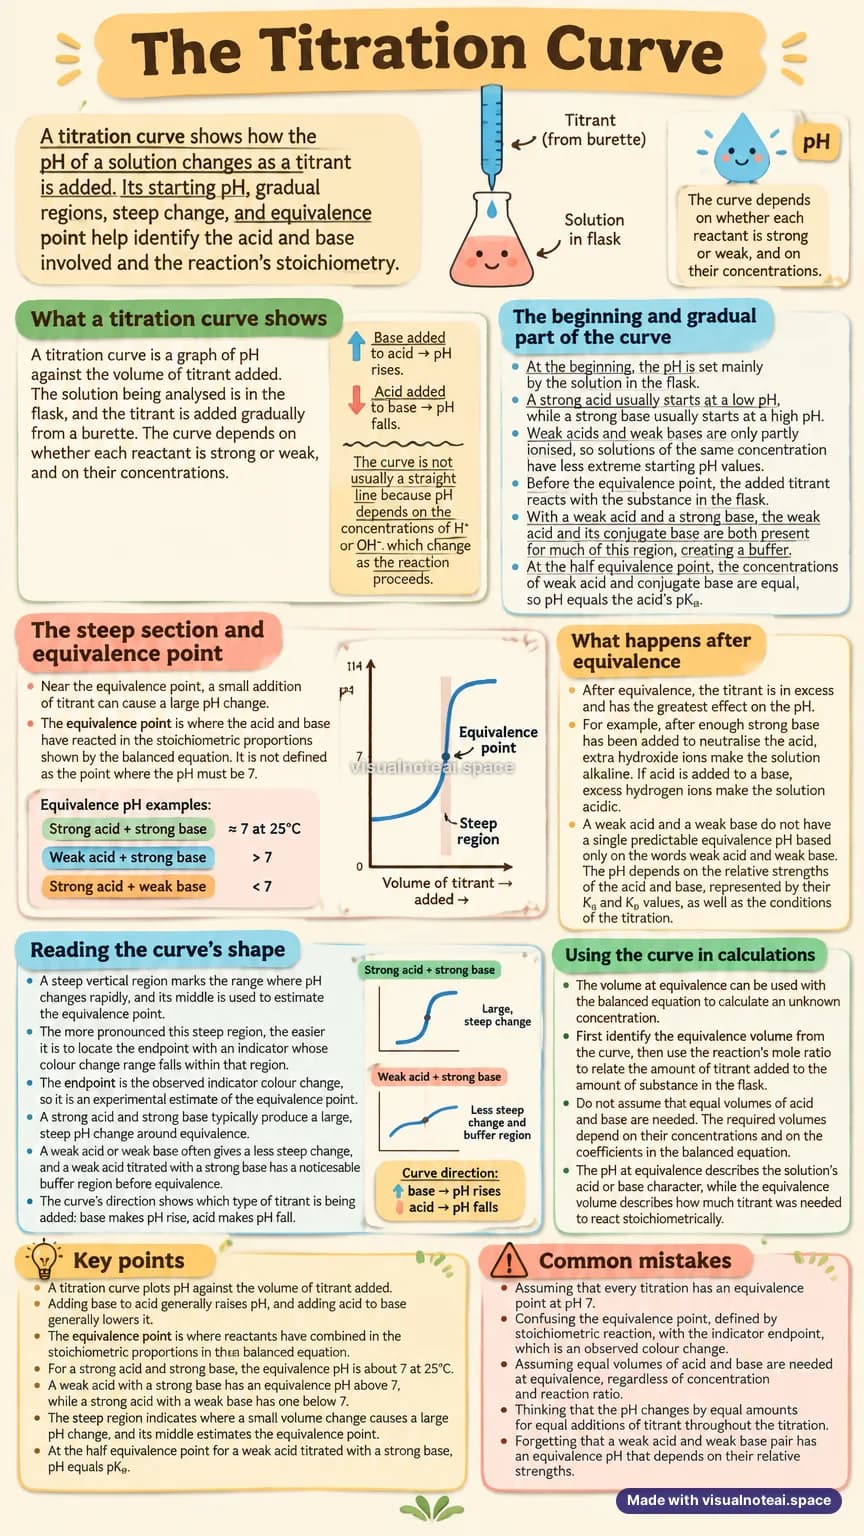
The whole topic on one page. Made with VisualNote.
!Common mistakes
- Assuming that every titration has an equivalence point at pH 7.
- Confusing the equivalence point, defined by stoichiometric reaction, with the indicator endpoint, which is an observed colour change.
- Assuming equal volumes of acid and base are needed at equivalence, regardless of concentration and reaction ratio.
- Thinking that the pH changes by equal amounts for equal additions of titrant throughout the titration.
- Forgetting that a weak acid and weak base pair has an equivalence pH that depends on their relative strengths.
🧠Explore the map33 ideas
The mind map VisualNote made for this topic. Drag to pan, scroll to zoom.
- Titration Curves
- What the Curve Shows
- pH versus titrant volume
- Flask contains analyte; burette adds titrant
- Curve depends on reactant strength and concentration
- Adding base raises pH; adding acid lowers pH
- Curve Regions
- Starting pH set mainly by flask solution
- Strong acids and bases have more extreme starting pH
- Weak acids and bases are partly ionised
- Before equivalence: titrant reacts with flask contents
- Buffer region with weak acid and strong base
- Starting pH set mainly by flask solution
- Equivalence Point
- Stoichiometric proportions from balanced equation
- Not necessarily at pH 7
- Strong acid with strong base: about pH 7 at 25°C
- Weak acid with strong base: above pH 7
- Strong acid with weak base: below pH 7
- Weak acid with weak base: pH depends on Ka and Kb
- After equivalence: excess titrant controls pH
- Curve Shape and Endpoint
- Steep region: small volume change causes large pH change
- Middle of steep region estimates equivalence point
- Steeper change makes indicator selection easier
- Endpoint: observed indicator colour change
- Endpoint estimates, but is distinct from, equivalence point
- Weak acid with strong base often has less steep change
- Steep region: small volume change causes large pH change
- Calculations from the Curve
- Identify equivalence volume
- Use balanced-equation mole ratio
- Calculate unknown concentration
- Required volumes depend on concentration and reaction coefficients
- Equivalence pH describes solution character; volume gives stoichiometric amount
- What the Curve Shows
🃏Flashcards14 cards
- What does a titration curve plot?
- It plots the solution’s pH against the volume of titrant added.
- How does adding base to an acid, or acid to a base, usually affect pH?
- Adding base to an acid generally raises pH; adding acid to a base generally lowers it.
- What mainly determines the starting pH of a titration?
- The solution in the flask. Strong acids and bases usually have more extreme starting pH values than weak acids and bases of the same concentration.
- Why does a weak acid and strong base titration have a buffer region?
- Before equivalence, both the weak acid and its conjugate base are present, so they buffer the solution and pH changes gradually.
- What is true at the half-equivalence point for a weak acid titrated with a strong base?
- The weak acid and conjugate base concentrations are equal, and pH equals the acid’s pKa.
- What defines the equivalence point?
- It is where acid and base have reacted in the stoichiometric proportions given by the balanced equation. It is not necessarily where pH is 7.
- What is the equivalence-point pH for a strong acid and strong base titration at 25°C?
- It is about pH 7.
- Why is the equivalence-point pH above 7 for a weak acid titrated with a strong base?
- The conjugate base formed reacts with water to produce hydroxide ions.
- Why is the equivalence-point pH below 7 for a strong acid titrated with a weak base?
- The conjugate acid formed reacts with water to produce hydrogen ions.
- What does the steep region of a titration curve indicate?
- A small addition of titrant causes a large pH change. The middle of this region helps estimate the equivalence point.
- How do the endpoint and equivalence point differ?
- The equivalence point is defined by stoichiometric reaction; the endpoint is the observed indicator colour change and estimates the equivalence point.
- How can a titration curve be used to calculate an unknown concentration?
- Identify the equivalence volume, multiply by the titrant’s concentration to get moles of titrant, then use the balanced equation’s mole ratio to find the moles in the flask and divide by the flask volume.
- Why are equal volumes of acid and base not always needed at equivalence?
- The required volumes depend on the reactant concentrations and the coefficients in the balanced equation.
- What determines the equivalence pH of a weak acid and weak base titration?
- It depends on the relative acid and base strengths, represented by their Ka and Kb values, and on the titration conditions.
✅Test yourself5 questions
What defines the equivalence point on a titration curve?
The equivalence point is defined by the stoichiometric proportions of the reaction, not by a particular pH, colour change, or equal volumes.
At the half equivalence point when a weak acid is titrated with a strong base, what relationship holds?
At half equivalence, the weak acid and its conjugate base have equal concentrations, so the pH equals the acid’s pKa.
Why is the equivalence-point pH above 7 when a weak acid is titrated with a strong base?
The conjugate base formed in the reaction reacts with water to produce hydroxide ions, making the solution basic.
Which statement best distinguishes an indicator endpoint from the equivalence point?
The endpoint is observed through the indicator’s colour change, whereas the equivalence point is defined by stoichiometric reaction.
What information, together with the balanced equation, is needed to use a titration curve to calculate an unknown concentration?
The equivalence volume times the titrant’s concentration gives the moles of titrant used, and the balanced equation’s mole ratio relates that to the moles of analyte.
📝The notes
What a titration curve shows
A titration curve is a graph of pH against the volume of titrant added. The solution being analysed is in the flask, and the titrant is added gradually from a burette. The curve depends on whether each reactant is strong or weak, and on their concentrations.
When a base is added to an acid, the pH generally rises. When an acid is added to a base, the pH generally falls. The curve is not usually a straight line because pH depends on the concentrations of hydrogen ions or hydroxide ions, which change as the reaction proceeds.
The beginning and gradual part of the curve
At the beginning, the pH is set mainly by the solution in the flask. A strong acid usually starts at a low pH, while a strong base usually starts at a high pH. Weak acids and weak bases are only partly ionised, so solutions of the same concentration usually have less extreme starting pH values than strong acids or bases.
Before the equivalence point, the added titrant reacts with the substance in the flask. With a weak acid and a strong base, the weak acid and its conjugate base are both present for much of this region, creating a buffer. The pH then changes gradually. At the half equivalence point in this titration, the concentrations of weak acid and conjugate base are equal, so pH equals the acid’s pKa.
The steep section and equivalence point
Near the equivalence point, a small addition of titrant can cause a large pH change. The equivalence point is where the acid and base have reacted in the stoichiometric proportions shown by the balanced equation. It is not defined as the point where the pH must be 7.
For a strong acid titrated with a strong base, the equivalence point is about pH 7 at 25 degrees Celsius. For a weak acid titrated with a strong base, it is above pH 7 because the conjugate base formed reacts with water to produce hydroxide ions. For a strong acid titrated with a weak base, it is below pH 7 because the conjugate acid formed reacts with water to produce hydrogen ions.
What happens after equivalence
After equivalence, the titrant is in excess and has the greatest effect on the pH. For example, after enough strong base has been added to neutralise the acid, extra hydroxide ions make the solution alkaline. If acid is added to a base, excess hydrogen ions make the solution acidic.
A weak acid and a weak base do not have a single predictable equivalence pH based only on the words weak acid and weak base. The pH depends on the relative strengths of the acid and base, represented by their Ka and Kb values, as well as the conditions of the titration.
Reading the curve’s shape
A steep vertical region marks the range where pH changes rapidly, and its middle is used to estimate the equivalence point. The more pronounced this steep region, the easier it is to locate the endpoint with an indicator whose colour change range falls within that region. The endpoint is the observed indicator colour change, so it is an experimental estimate of the equivalence point.
A strong acid and strong base typically produce a large, steep pH change around equivalence. A weak acid or weak base often gives a less steep change, and a weak acid titrated with a strong base has a noticeable buffer region before equivalence. The curve’s direction also shows which type of titrant is being added: adding base makes pH rise, while adding acid makes pH fall.
Using the curve in calculations
The volume at equivalence can be used with the balanced equation to calculate an unknown concentration. First identify the equivalence volume from the curve, multiply it by the titrant’s concentration to get the moles of titrant added, then use the reaction’s mole ratio to find the moles of substance in the flask. Dividing by the volume of solution in the flask gives its concentration.
Do not assume that equal volumes of acid and base are needed. The required volumes depend on their concentrations and on the coefficients in the balanced equation. The pH at equivalence describes the solution’s acid or base character, while the equivalence volume describes how much titrant was needed to react stoichiometrically.
Make this for your own notes
Paste a chapter or a PDF and get the sheet, map, cards, quiz and episode back in about a minute. No credit card.