
Hardy-Weinberg equilibrium is a model for predicting genotype frequencies from allele frequencies in a population. It also provides a baseline for spotting when evolutionary forces or non-random mating may be affecting a population.
★What to remember
- For two alleles, p + q = 1.
- At Hardy-Weinberg equilibrium, genotype frequencies are p², 2pq, and q².
- The genotype frequencies add to 1: p² + 2pq + q² = 1.
- The assumptions are a very large population, random mating, no mutation, no migration, and no selection.
- No mutation, migration, or selection, together with negligible genetic drift, keeps allele frequencies constant across generations.
- Random mating produces the expected genotype proportions, but non-random mating does not necessarily change allele frequencies.
- A difference between observed and expected genotype frequencies does not by itself reveal which assumption was violated.
🎧Listen3:26 · transcript
AnnaLet’s make Hardy-Weinberg equilibrium feel less like a formula to memorize. Marco, what is the model actually for?
MarcoIt predicts genotype frequencies from allele frequencies in a population. And it gives us a baseline. If observed genotypes differ from the prediction, something about the model’s assumptions may not hold. But that difference alone doesn’t tell us what happened.
AnnaSo it’s a comparison, not a diagnosis. Let’s set up the equations. We have two alleles, A and a. Their frequencies are p and q, and p plus q equals one.
MarcoRight. Under the model, the expected frequencies are p squared for AA, two p q for Aa, and q squared for aa. Those add to one. You can see why from combining alleles at random: it’s the expansion of p plus q, squared.
AnnaAnd what assumptions sit behind that prediction?
MarcoA very large population, random mating for the gene we’re studying, no mutation, no migration, and no natural selection affecting the alleles. The population-size assumption matters because it makes chance shifts, or genetic drift, negligible.
AnnaI want to pause on random mating. People sometimes say it’s what keeps allele frequencies constant. Is that right?
MarcoNot by itself. Random mating produces the expected genotype proportions. The other conditions rule out processes that change allele frequencies, and a large population limits drift. Inbreeding, for example, can raise the proportion of homozygotes and lower heterozygotes without necessarily changing p or q.
AnnaThat distinction is useful. How would you use the equations if a problem gives you a recessive phenotype frequency?
MarcoIf that phenotype occurs only in homozygous recessive individuals, treat its frequency as q squared. Take the square root to get q, then calculate p as one minus q. The expected carrier frequency is two p q. But that depends both on the model assumptions and on the phenotype reliably identifying aa.
AnnaLet’s do the source’s numbers. If q squared is zero point zero nine, the square root gives q as zero point three. Then p is zero point seven. So AA is zero point four nine, Aa is zero point four two, and aa is zero point zero nine.
MarcoExactly. Now, if a problem describes people moving into or out of a population, what clue is that?
AnnaMigration, or gene flow. A new allele points to mutation. A genotype with a survival or reproductive advantage suggests selection. A small population or a chance event causing a sharp change suggests drift. And mate preference or inbreeding points to non-random mating.
MarcoWhich brings us back to being careful. Non-random mating most directly changes genotype proportions, often increasing homozygotes. It doesn’t necessarily change allele frequencies. And a mismatch between observed counts and p squared, two p q, and q squared doesn’t prove selection.
AnnaRight. Several forces can act together, and sampling variation can also create a difference. A population might even have the expected genotype proportions at one moment while its allele frequencies change between generations, if selection acts after those genotypes form.
MarcoSo the best question is not just, “Do the counts match?” It’s, “What does the problem actually tell us, and which assumption does that evidence support?”
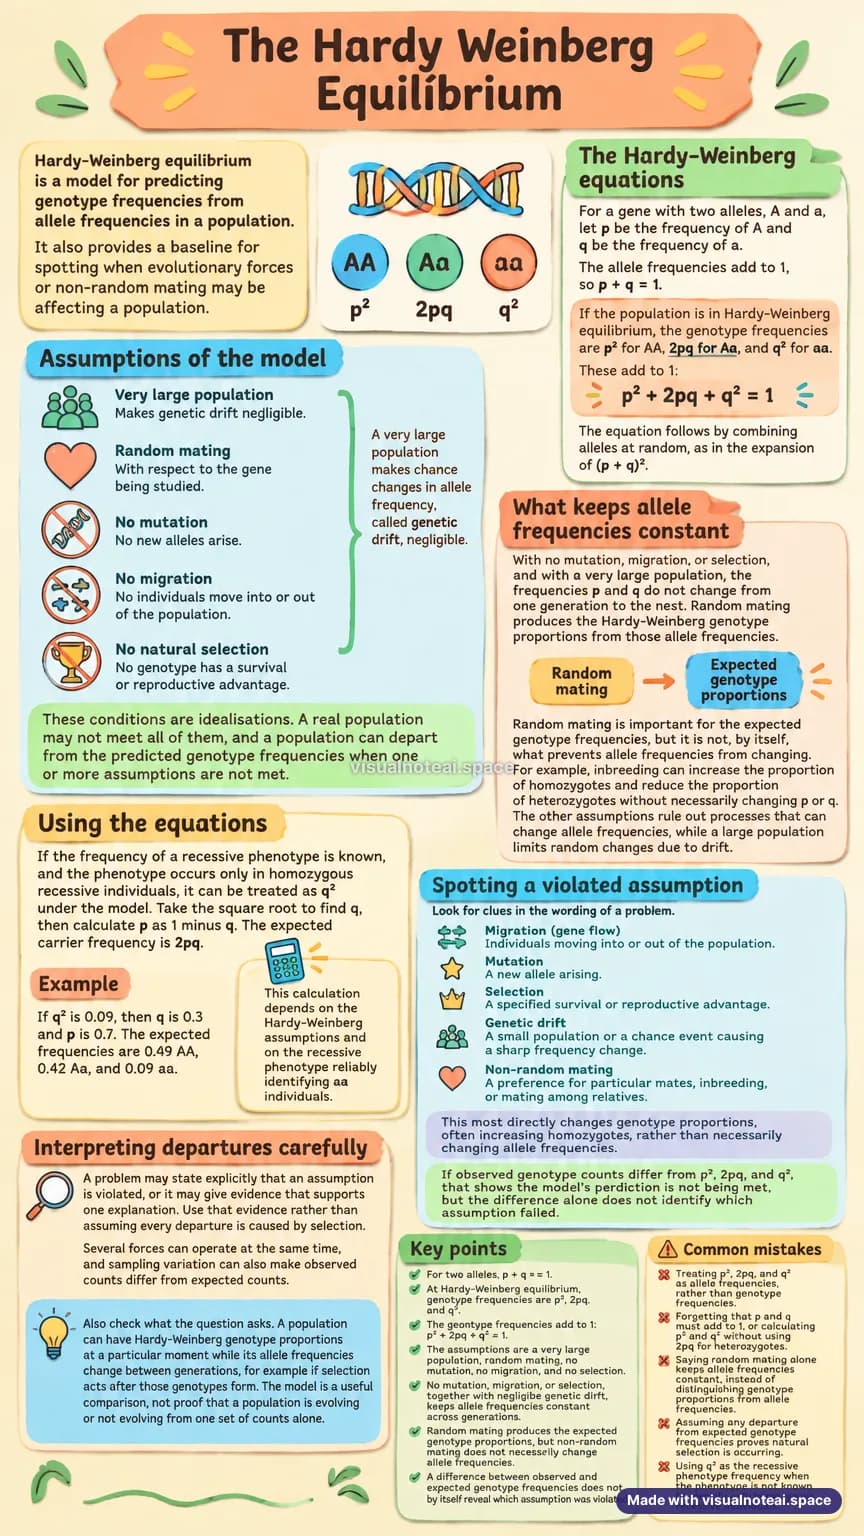
The whole topic on one page. Made with VisualNote.
!Common mistakes
- Treating p², 2pq, and q² as allele frequencies, rather than genotype frequencies.
- Forgetting that p and q must add to 1, or calculating p² and q² without using 2pq for heterozygotes.
- Saying random mating alone keeps allele frequencies constant, instead of distinguishing genotype proportions from allele frequencies.
- Assuming any departure from expected genotype frequencies proves natural selection is occurring.
- Using q² as the recessive phenotype frequency when the phenotype is not known to identify only homozygous recessive individuals.
🧠Explore the map32 ideas
The mind map VisualNote made for this topic. Drag to pan, scroll to zoom.
- Hardy-Weinberg Equilibrium
- Purpose and Model
- Predicts genotype frequencies from allele frequencies
- Baseline for detecting departures from equilibrium
- Equations
- Allele frequencies: p + q = 1
- Genotype frequencies: p² (AA), 2pq (Aa), q² (aa)
- Total genotype frequency: p² + 2pq + q² = 1
- Model Assumptions
- Very large population; negligible genetic drift
- Random mating for the studied gene
- No mutation, migration, or natural selection
- Allele Frequencies and Mating
- No mutation, migration, or selection preserves allele frequencies
- Random mating produces expected genotype proportions
- Inbreeding can increase homozygotes and reduce heterozygotes
- Non-random mating need not change allele frequencies
- Using the Equations
- If recessive phenotype uniquely identifies aa, its frequency is q²
- Find q = √q², then p = 1 − q
- Expected carrier frequency: 2pq
- Example: q² = 0.09; q = 0.3; p = 0.7
- Example genotypes: AA 0.49, Aa 0.42, aa 0.09
- Identifying and Interpreting Departures
- Movement into or out of population: migration (gene flow)
- New allele: mutation; survival or reproductive advantage: selection
- Small population or chance frequency change: genetic drift
- Mate preference or relatives mating: non-random mating
- Observed-versus-expected difference alone does not identify the cause
- Consider multiple forces and sampling variation
- Equilibrium proportions at one moment do not prove stable allele frequencies
- A departure does not by itself prove natural selection or evolution
- Purpose and Model
🃏Flashcards12 cards
- What is the Hardy-Weinberg equilibrium model used for?
- It predicts genotype frequencies from allele frequencies and provides a baseline for identifying possible evolutionary forces or non-random mating.
- What do p and q represent, and how are they related?
- For two alleles, p is the frequency of A and q is the frequency of a. Their frequencies sum to 1: p + q = 1.
- What genotype frequencies does Hardy-Weinberg equilibrium predict?
- The expected frequencies are p² for AA, 2pq for Aa, and q² for aa.
- What equation shows that the genotype frequencies sum to 1?
- p² + 2pq + q² = 1, which follows from expanding (p + q)².
- What are the standard Hardy-Weinberg assumptions?
- The population is very large, mating is random for the gene studied, and there is no mutation, migration, or natural selection affecting the alleles.
- How do the assumptions relate to constant allele frequencies?
- No mutation, migration, or selection, together with negligible genetic drift in a very large population, keeps allele frequencies constant across generations.
- What is the role of random mating in the model?
- Random mating produces the expected genotype proportions from the allele frequencies. It is not, by itself, what prevents allele frequencies from changing.
- How can inbreeding affect genotype frequencies?
- Inbreeding can increase homozygotes and reduce heterozygotes without necessarily changing allele frequencies.
- How can a recessive phenotype frequency be used to estimate genotype frequencies?
- If the phenotype occurs only in aa individuals, its frequency is q². Take the square root to find q, calculate p = 1 − q, then use p², 2pq, and q².
- If q² = 0.09, what are p and the expected genotype frequencies?
- q = 0.3 and p = 0.7. Expected frequencies are 0.49 AA, 0.42 Aa, and 0.09 aa.
- What clues suggest particular Hardy-Weinberg assumptions are violated?
- Migration suggests gene flow; a new allele suggests mutation; genotype-specific survival or reproductive advantage suggests selection; and a small population or chance frequency shift suggests genetic drift.
- Does a difference between observed and expected genotype frequencies identify the cause?
- No. It shows that the prediction is not being met, but does not identify which assumption failed; multiple forces or sampling variation may contribute.
✅Test yourself5 questions
In a two-allele population at Hardy-Weinberg equilibrium, what does 2pq represent?
The expected genotype frequency of heterozygotes Aa is 2pq.
A recessive phenotype occurs only in aa individuals and has frequency 0.16 in a population meeting the Hardy-Weinberg assumptions; what is the expected carrier frequency?
Since q² = 0.16, q = 0.4 and p = 0.6, so the carrier frequency 2pq is 0.48.
Which statement best describes the role of random mating in the Hardy-Weinberg model?
Random mating produces the expected genotype proportions, while other assumptions limit changes in allele frequencies.
A population begins mating mainly among close relatives, with no other changes specified; what is the most direct expected effect?
Inbreeding tends to increase homozygosity and reduce heterozygosity without necessarily changing allele frequencies.
Observed genotype frequencies differ from p², 2pq, and q²; what can be concluded from this difference alone?
A departure from expected genotype frequencies does not by itself reveal which assumption failed or what caused the difference.
📝The notes
The Hardy-Weinberg equations
For a gene with two alleles, A and a, let p be the frequency of A and q be the frequency of a. The allele frequencies add to 1, so p + q = 1.
If the population is in Hardy-Weinberg equilibrium, the genotype frequencies are p² for AA, 2pq for Aa, and q² for aa. These add to 1: p² + 2pq + q² = 1. The equation follows by combining alleles at random, as in the expansion of (p + q)².
Assumptions of the model
The standard model assumes a very large population, random mating with respect to the gene being studied, no mutation, no migration into or out of the population, and no natural selection affecting the alleles. A very large population makes chance changes in allele frequency, called genetic drift, negligible.
These conditions are idealisations. A real population may not meet all of them, and a population can depart from the predicted genotype frequencies when one or more assumptions are not met.
What keeps allele frequencies constant
With no mutation, migration, or selection, and with a very large population, the frequencies p and q do not change from one generation to the next. Random mating produces the Hardy-Weinberg genotype proportions from those allele frequencies.
Random mating is important for the expected genotype frequencies, but it is not, by itself, what prevents allele frequencies from changing. For example, inbreeding can increase the proportion of homozygotes and reduce the proportion of heterozygotes without necessarily changing p or q. The other assumptions rule out processes that can change allele frequencies, while a large population limits random changes due to drift.
Using the equations
If the frequency of a recessive phenotype is known, and the phenotype occurs only in homozygous recessive individuals, it can be treated as q² under the model. Take the square root to find q, then calculate p as 1 minus q. The expected carrier frequency is 2pq.
For example, if q² is 0.09, then q is 0.3 and p is 0.7. The expected frequencies are 0.49 AA, 0.42 Aa, and 0.09 aa. This calculation depends on the Hardy-Weinberg assumptions and on the recessive phenotype reliably identifying aa individuals.
Spotting a violated assumption
Look for clues in the wording of a problem. Individuals moving into or out of the population suggest migration, also called gene flow. A new allele arising suggests mutation. A specified survival or reproductive advantage for a genotype suggests natural selection. A small population or a chance event causing a sharp frequency change suggests genetic drift.
A preference for particular mates, inbreeding, or mating among relatives points to non-random mating. This most directly changes genotype proportions, often increasing homozygotes, rather than necessarily changing allele frequencies. If observed genotype counts differ from p², 2pq, and q², that shows the model's prediction is not being met, but the difference alone does not identify which assumption failed.
Interpreting departures carefully
A problem may state explicitly that an assumption is violated, or it may give evidence that supports one explanation. Use that evidence rather than assuming every departure is caused by selection. Several forces can operate at the same time, and sampling variation can also make observed counts differ from expected counts.
Also check what the question asks. A population can have Hardy-Weinberg genotype proportions at a particular moment while its allele frequencies change between generations, for example if selection acts after those genotypes form. The model is a useful comparison, not proof that a population is evolving or not evolving from one set of counts alone.
Make this for your own notes
Paste a chapter or a PDF and get the sheet, map, cards, quiz and episode back in about a minute. No credit card.