
Supply, Demand & Elasticity: Visual Notes and Flashcards
A chapter of run-on economics notes about curves, shifts and elasticity, rebuilt as a single labelled diagram you can read in one glance, with a matching flashcard deck for the details that only stick through recall.
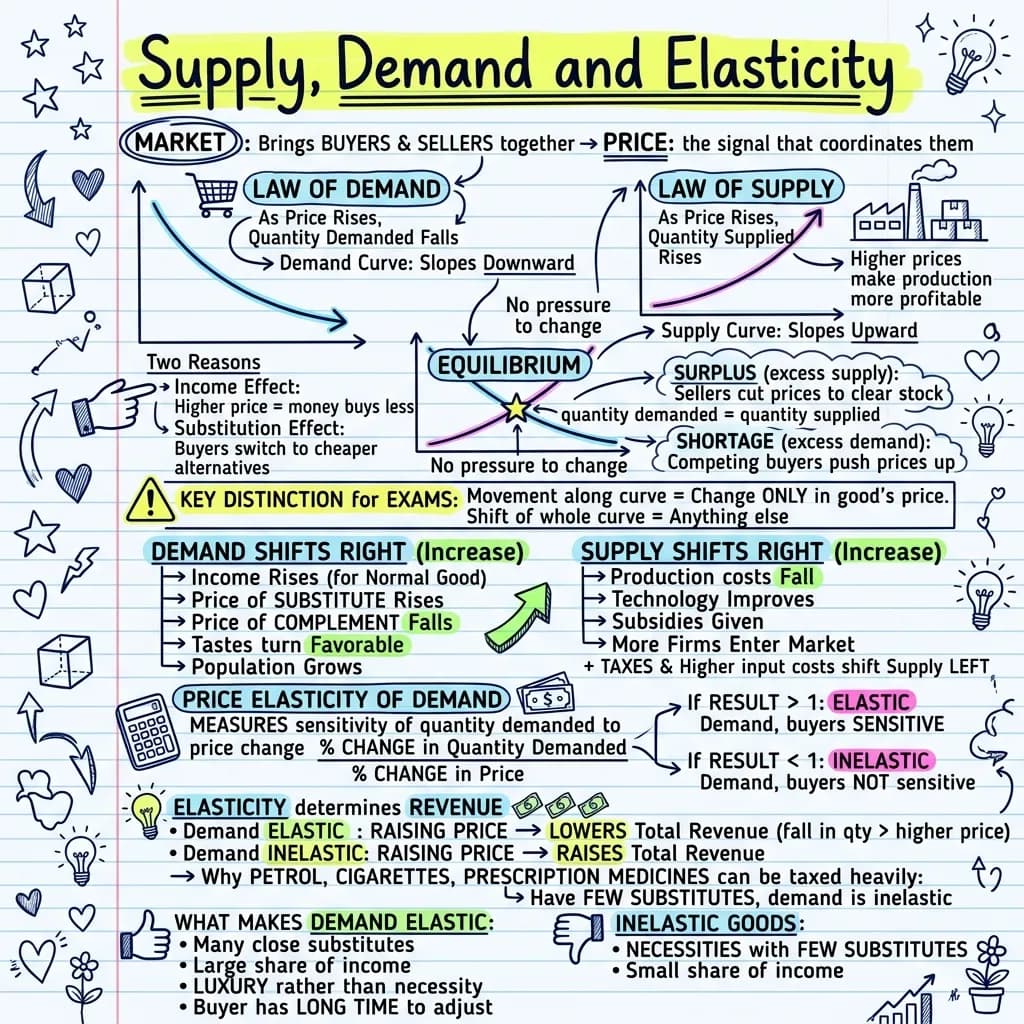
Unit 2: Markets. The law of demand states that as the price of a good rises the quantity demanded falls, all other things being equal, which is why the demand curve slopes downward, and the two reasons given for this are the income effect (a higher price makes the consumer poorer in real terms so they buy less) and the substitution effect (a higher price makes rival goods look cheaper so buyers switch). The law of supply states that as price rises the quantity supplied rises because higher prices make production more profitable, so the supply curve slopes upward. Equilibrium is where the two curves cross and the market clears; above the equilibrium price quantity supplied exceeds quantity demanded and there is a surplus which pushes price down; below it quantity demanded exceeds quantity supplied and there is a shortage which pushes price up. Important distinction: a change in the price of the good itself causes a movement along the curve (an extension or contraction) while a change in any other factor causes the whole curve to shift. Demand shifts right on higher incomes for a normal good, a rise in the price of a substitute, a fall in the price of a complement, a bigger population, or favourable tastes and advertising. Supply shifts right on lower input costs, better technology, subsidies, more firms in the market, and good weather for agricultural goods. Price elasticity of demand equals the percentage change in quantity demanded divided by the percentage change in price and the sign is normally ignored; if the value is greater than 1 demand is elastic and quantity responds more than proportionately, if it is less than 1 demand is inelastic. Determinants include the availability of substitutes, whether the good is a necessity or a luxury, the share of income spent on it, and the time period considered. Revenue link: if demand is elastic raising price lowers total revenue and cutting price raises it; if demand is inelastic raising price raises total revenue. This explains why governments place heavy indirect taxes on petrol and cigarettes, which have few substitutes and inelastic demand, so tax revenue stays high and quantity falls only a little.
The flashcards from the same notes
Exports as Anki CSV, printable PDF, or plain text.
Which two effects explain why the demand curve slopes downward?
The income effect (a higher price cuts real purchasing power) and the substitution effect (a higher price makes rival goods relatively cheaper).
What exists in a market when the price is set above equilibrium?
A surplus: quantity supplied exceeds quantity demanded, which pushes the price back down.
What is the only cause of a movement along a demand curve?
A change in the price of the good itself. Every other factor shifts the whole curve instead.
State the formula for price elasticity of demand.
Percentage change in quantity demanded divided by percentage change in price.
Demand for a good is elastic. What happens to total revenue if the seller raises the price?
Total revenue falls, because quantity demanded drops by a larger percentage than the price rise.
Why can governments tax petrol and cigarettes heavily without losing much revenue?
Demand for both is inelastic (few substitutes, habitual use), so quantity falls only slightly while revenue per unit rises.
Make a deck from your own notes with the AI flashcard generator.
What's in this visual
Supply and demand looks simple until the exam asks whether the curve moved or you moved along it, and elasticity is where marks are quietly lost every year. The visual above puts both curves, the equilibrium point, the shifters and the elasticity formula on one page, so the relationships are visible instead of buried in prose. Here is the full walkthrough.
The law of demand and why the curve slopes down
The law of demand says that, holding everything else constant, a higher price means a lower quantity demanded. Two effects explain the downward slope. The income effect: a price rise leaves your budget buying less, so your real income falls and you cut back. The substitution effect: a price rise makes competing goods look cheaper by comparison, so you switch to them. Both push in the same direction, which is why the curve runs from top left to bottom right on almost every diagram you will ever draw.
The law of supply, equilibrium, surplus and shortage
The law of supply runs the other way: a higher price makes production more profitable, so firms offer more, and the supply curve slopes upward. Where the two curves cross you get equilibrium, the single price at which quantity demanded equals quantity supplied and the market clears. Above that price there is a surplus (unsold stock forces sellers to cut prices); below it there is a shortage (buyers compete and bid the price up). The market is self-correcting, and the diagram shows why: both disequilibrium states sit visibly above and below the crossing point.
The distinction that decides exam marks: movement versus shift
This is the single most examined idea in the topic. A change in the price of the good itself moves you along the existing curve, called an extension or a contraction. A change in anything else shifts the whole curve to a new position. Demand shifts right when incomes rise for a normal good, when a substitute gets more expensive, when a complement gets cheaper, when the population grows, or when tastes and advertising favour the good. Supply shifts right when input costs fall, when technology improves, when subsidies arrive, when more firms enter, or when the harvest is good. Say the wrong one in an essay and the rest of the answer collapses.
Price elasticity of demand and total revenue
Price elasticity of demand is the percentage change in quantity demanded divided by the percentage change in price, with the negative sign conventionally ignored. Above 1 demand is elastic and quantity reacts more than proportionately; below 1 it is inelastic and quantity barely moves. The revenue rule follows directly: with elastic demand a price rise cuts total revenue, while with inelastic demand a price rise raises it. It also explains public policy. Petrol and cigarettes have few substitutes and habitual buyers, so demand is inelastic, so heavy indirect taxes bring in reliable revenue while sales fall only slightly.
Why the diagram and the deck work together
Curves, shifters and elasticity bands are spatial ideas, so a single labelled diagram beats three pages of prose for understanding. Definitions, formulas and the revenue rule are recall ideas, so they need testing rather than looking at. The flashcard deck under this visual was generated from the same source notes in the same pass, which is why the wording lines up exactly with the labels on the page. You can build both from your own economics notes with the AI flashcard generator.
For teachers
The problem
- Students draw the curves correctly and then shift the wrong one under exam pressure.
- Elasticity gets treated as a formula to plug numbers into rather than a prediction about revenue.
- Redrawing supply and demand diagrams on the board every lesson eats teaching time.
How to use it in class
- Project the diagram and work through surplus and shortage before naming them.
- Blank the shifter lists and have the class rebuild them in pairs.
- Set the flashcard deck as a five minute starter to check the definitions stuck.
- Hand out the page as the revision sheet for the markets unit test.
For students & visual learners
The problem
- You can recite both laws but freeze when asked whether the curve moves or you move along it.
- Elasticity numbers make sense in class and vanish the moment the question mentions revenue.
- Your notes describe the diagram in words, so you never actually picture it.
How to use it to study
- Revise the whole markets chapter from one page instead of rereading the textbook.
- Use the equilibrium picture to reason out surplus and shortage rather than memorising them.
- Run the six cards until the movement versus shift rule is automatic.
- Redraw the diagram from memory and check it against the visual.
Make your own visual like this
Paste your notes or upload a PDF
Drop in your own class notes, a textbook chapter or a PDF. Any subject, any language.
Pick a visual style
Choose a sketchnote, infographic or diagram style that fits the topic.
Generate and download
In about 15–40 seconds you get a one-page visual you can print, share or revise from.
Frequently asked questions
What is the difference between a shift in demand and a movement along the demand curve?
A movement along the curve is caused only by a change in the price of the good itself. A shift of the whole curve is caused by anything else: income, the price of substitutes or complements, population, or tastes.
How do you know if demand is elastic or inelastic?
Divide the percentage change in quantity demanded by the percentage change in price and ignore the sign. A value above 1 is elastic, a value below 1 is inelastic. Goods with many substitutes and luxuries tend to be elastic; necessities and habit goods tend to be inelastic.
Can I turn my own economics notes into a visual and a flashcard deck?
Yes. Paste your notes or upload a chapter PDF and VisualNote AI produces the visual and the matching deck from the same source. Try the AI flashcard generator.
More visual examples

Turn your notes into a visual
Paste any notes or upload a PDF and get a sketchnote-style visual in under a minute.