The classic knowledge-base problem is engagement. A well-written onboarding doc takes 20 minutes to read. A new hire skims it for 90 seconds, hits a meeting, and never returns. The information is technically “available” but practically invisible.
Why knowledge bases need visual content
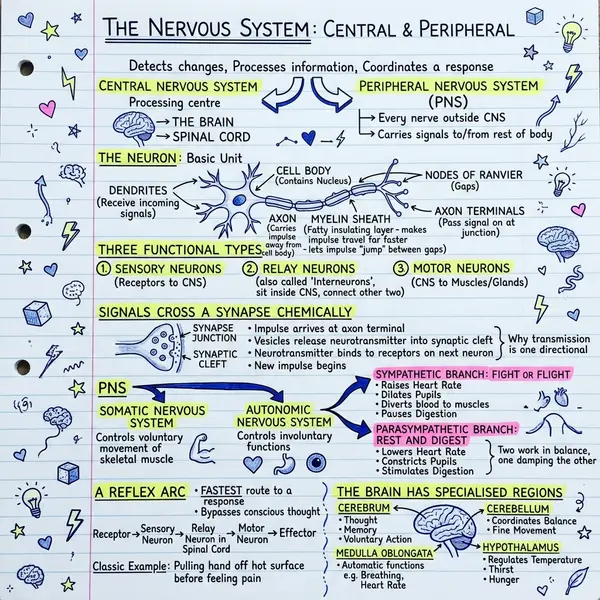
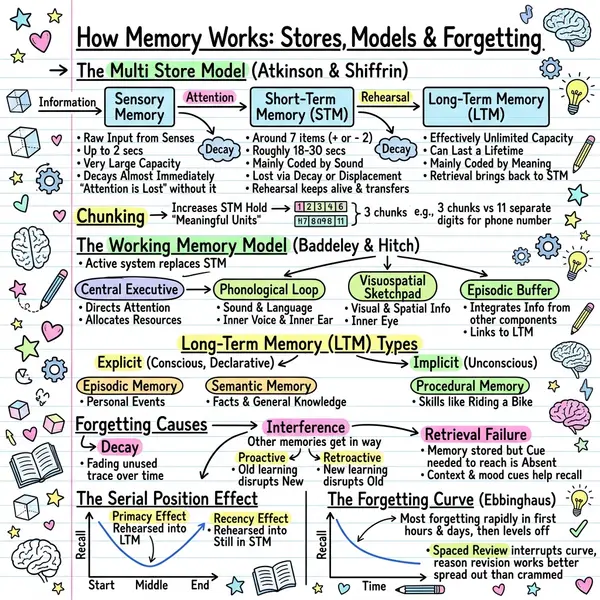
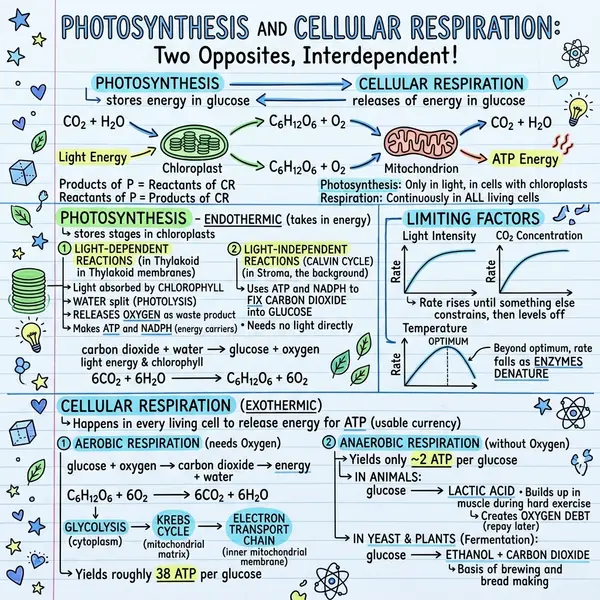
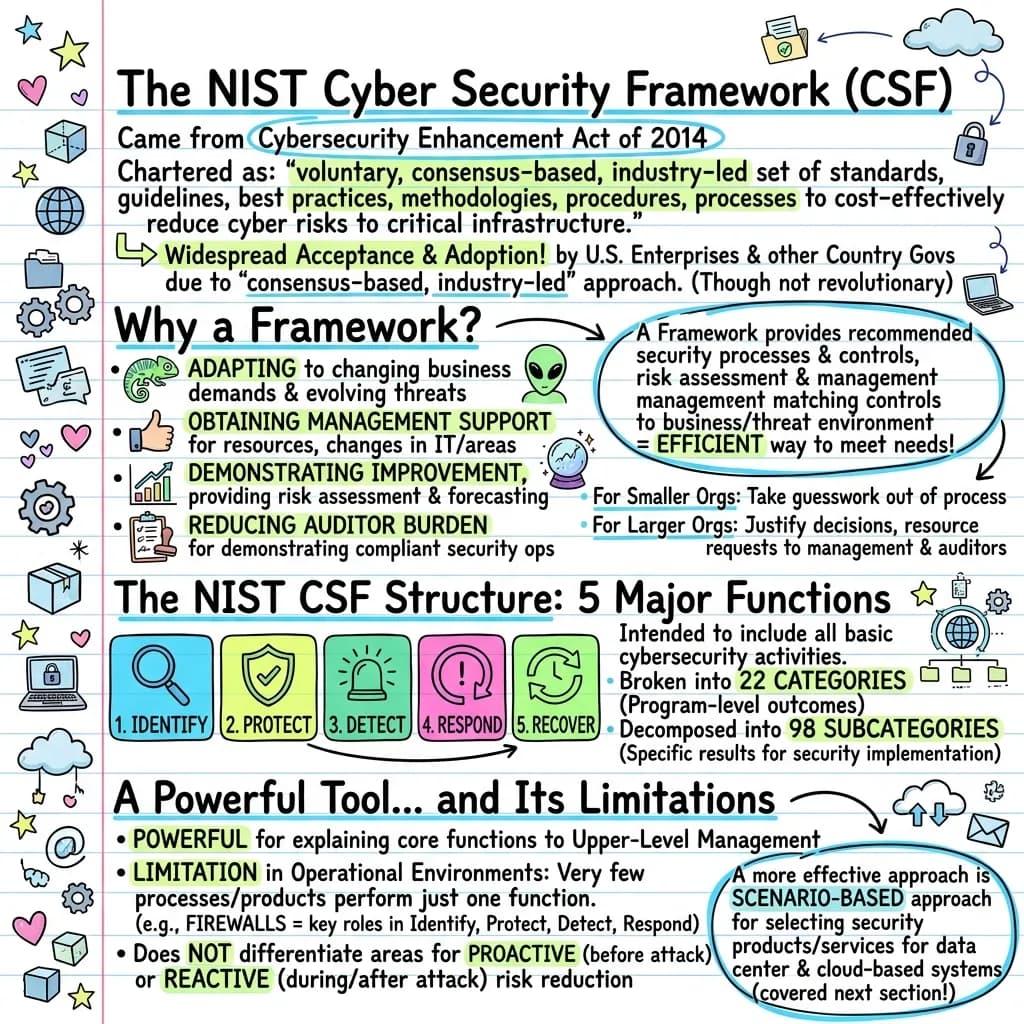
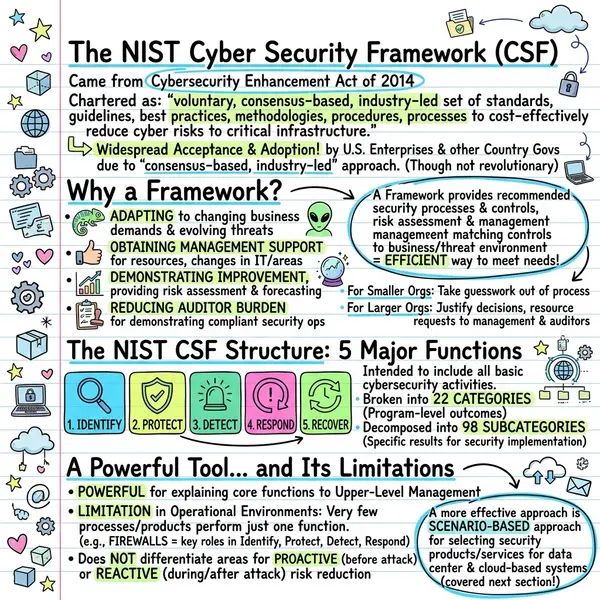
Visual content fixes the access problem. A one-page sketchnote of an onboarding doc gets opened, screenshotted, and shared in Slack. A visual runbook becomes a reference card people pin to their second monitor. A diagram of an architecture decision gets embedded in three other docs. Same information, visual form — multiplier on use.
What kinds of pages make great visuals
- Onboarding docs (turn each section into a visual chapter)
- Runbooks and playbooks (Timeline style works perfectly)
- Architecture decision records (ADRs) — Blueprint style
- Product spec summaries for stakeholder updates
- Process docs (hiring, support escalation, incident response)
- Quarterly reviews and OKR summaries
- Customer research synthesis pages
Step-by-step: KB page to visual
Pick the page worth visualising
Start with the page you wish more people read. Onboarding, top-3 runbooks, architecture overview.
Export as text or PDF
Notion: Export → Markdown & CSV. Confluence: Export → PDF. You only need body text — the AI handles structure.
Paste or upload
Text → notes-to-visual. PDF exports → PDF to infographic on the Plus plan.
Match style to doc
Onboarding → Classic. Runbooks → Timeline. Architecture → Blueprint. Comparisons → Kanban.
Generate + embed
20–40 seconds. Download the PNG and embed back at the top of the original page. Visual = landing card; text = deep-dive.
A real example: a 12-page engineering onboarding doc → one visual in Classic style → six new hires later, every one references it in their first week.
Frequently asked questions
Direct integration with Notion or Confluence?
Not yet — current workflow is export-then-paste. Native integration is on the roadmap.
Is content sent to a third-party AI?
Generation runs through OpenAI for text understanding and a separate image model for rendering. Content is not stored permanently. Review the privacy policy before using with confidential material.
Will the visual stay in sync with the source doc?
No — visuals are static PNGs. Plan to regenerate when the underlying doc changes meaningfully (typically once a quarter for stable docs).
What plan do I need?
Free for text input. Plus ($13.99/month) for direct PDF upload and higher limits. See pricing.